This is a post published by Luis de Souza on his blog "at the edge of time." Among other things, Luis is a researcher at the CRP Henri Tudor in Luxembourg and a PhD student at the Technical University of Lisbon. He is also one of the coauthors of the 33rd report to the Club of Rome titled "Plundering the Planet". Here, he presents an interpretation of the recent crisis as due to mineral scarcity.
Address on Raw Materials
I was recently invited by the JRC’s Institute for Environment and Sustainability (INTESA) to participate at workshop entitled "Scenario Building for a Sustainable Europe". The goal was to provide INTESA by reflecting on past long term scenario building experiences and examining key trends relevant for scenario development. According to the organisers this should happen "by debating conceptual alternatives to conventional growth ". I was tasked with a 20 minute address on Raw Materials.
Unlike most other presenters, my address was mostly focused on what happened in the recent past. More than making forecasts I believe it is important to understand that the way we explore the planet’s resources has been changing deeply since the begining of this century.
I reproduce this presentation and the main ideas accompanying each slide below.
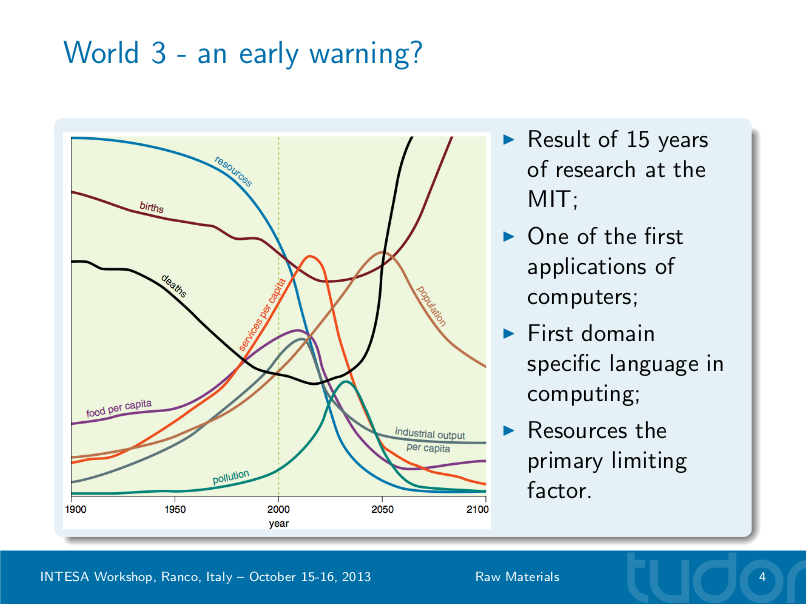
I would expect everyone at this workshop to have seen this graph before (and in all likelihood it is also familiar to most readers of this blog). These famous curves are not just that famous book published by the Club of Rome, it was actually the result of 15 years of research leaded by Jay Forrester at the MIT. This is the result of the standard run of World 3: resources are the main limiting factor of growth and the peak of industrial output is projected to happen right about now (2nd decade of the XXI century) in tandem with a peak in resource extraction.
The question is then if this particular model got it right or not. Searching for an answer I provide the movements of price and quantities extracted for some key raw materials. The prices are not adjusted for inflation, but since the data is for only the past decade the difference isn’t large.
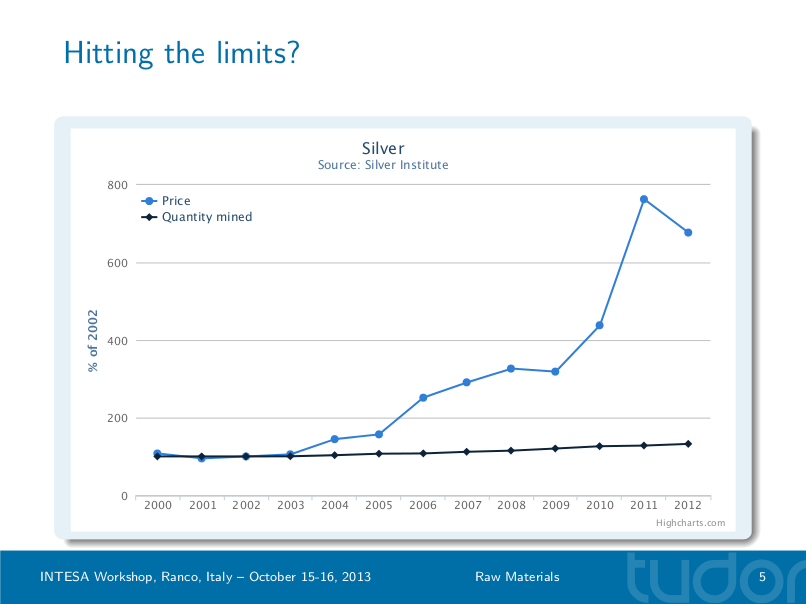
Silver has been one of the most spectacular raw materials in the market, with an increase of almost 800% in price between 2002 and 2011. Extraction rates are still growing strongly, about 50% plus in the decade, as the number of industrial applications of this metal continuously expands. But prices are moving up much faster.
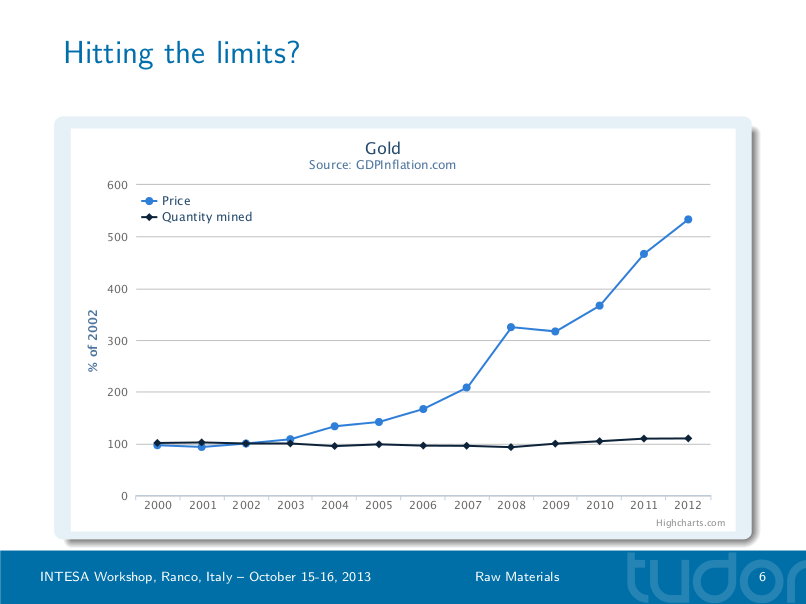
With gold we see similar price movements, a 550% increase in a decade. But contrary to silver, mined volumes are mostly stalled. Actually gold mining declined between 2001 and 2008, with the recent rebound coming exclusively from China. There are those who doubt these recent mined volumes from China, but I’ll stick with the official figures.
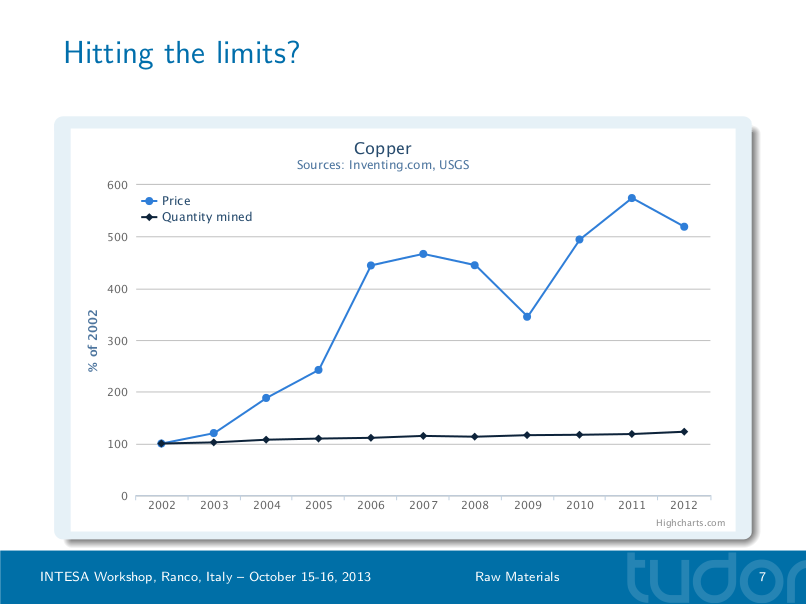
Copper is somewhere in between, volumes mined are going up, but not as strong as for silver, and again the price movements are of a different order of magnitude, now over 500% of what they were in 2002. Another interesting aspect of this metal is that the price started moving strongly earlier (2005) than for the other raw materials.
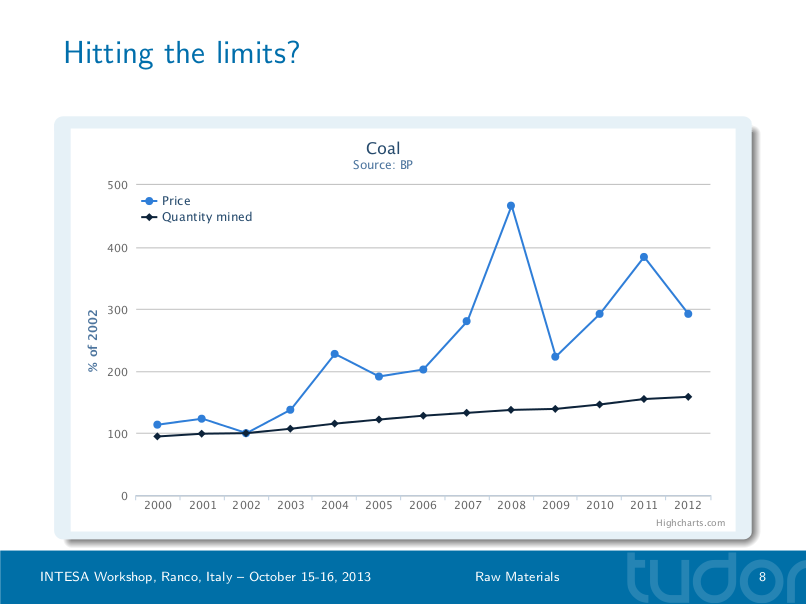
Now moving to energy resources we can see similar patterns with coal. Mined volumes are growing strongly, 50% in a decade, mostly on the back of China, where extraction has been increasing around 10% per year. Price movements appear not to be as strong as with other raw materials, but on a monthly basis there is was three fold increase from 2007 to 2008.
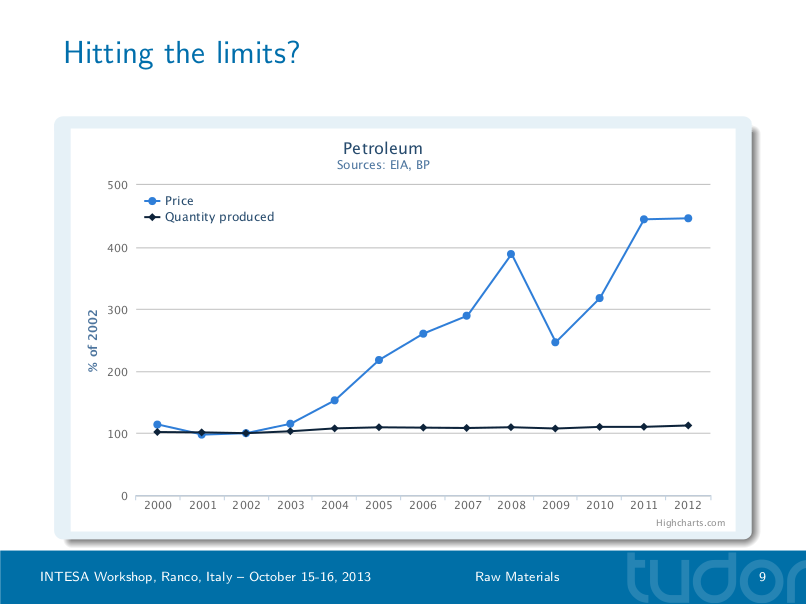
And finally petroleum, which accounts for 45% of international trade by weight. Again we see very relevant price increases, over 450% in a decade, against what can be classified as a very shy response in quantities extracted. Growth between 2006 and 2012 was only 3%, possibly within the margin of error of the data.
Right or wrong?
Are these price movements confirming the projections made with the World 3 model? Perhaps, but let us look closer at the model.
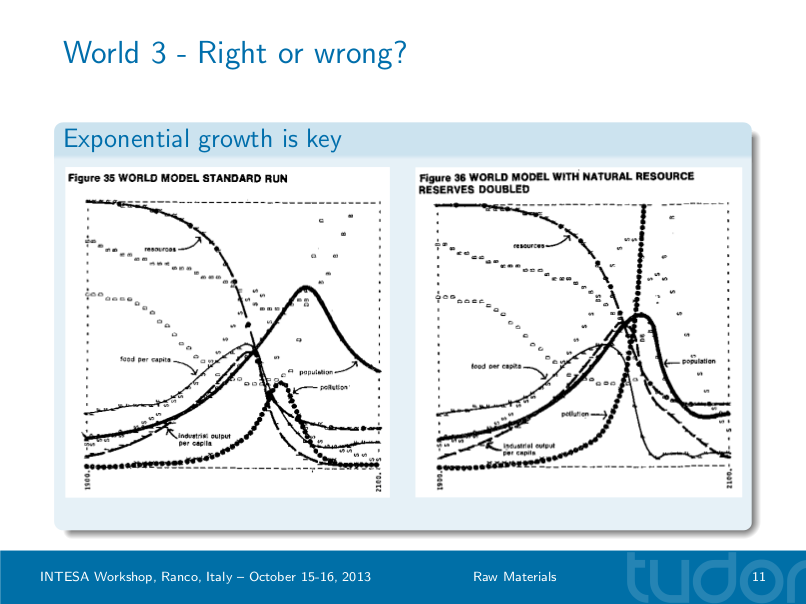
These two graphs are taken from the original version of the book, on the left is the standard run and on the right an alternative run with the amount of resources doubled. In this alternative run pollution eventually becomes the overwhelming factor, but what is most important to observe is that with double the amount of resources industrial output peaks a mere decade later compared to the standard run. There was a reason the book was called "Limits to Growth", it is in fact an exercise on exponential growth: the higher you go the harder it gets to keep climbing.
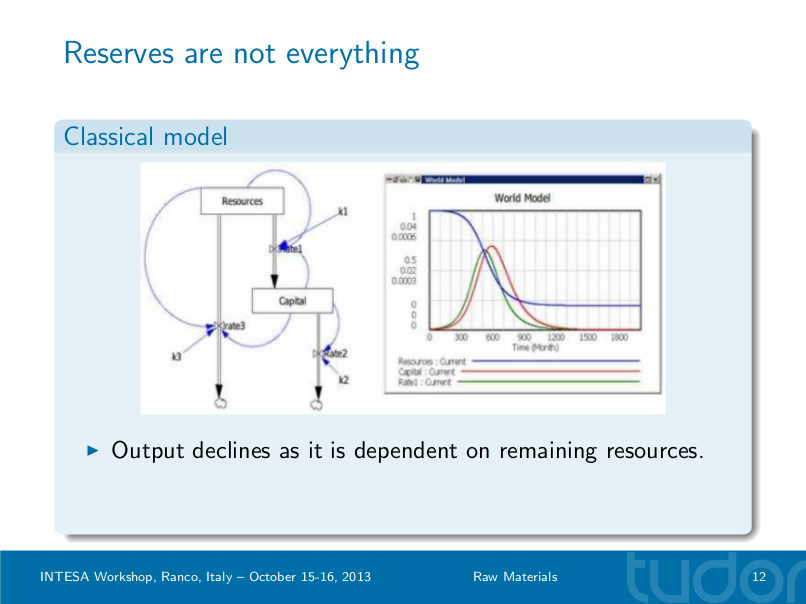
There is a second aspect to this model that is also important to observe. This is a picture I stole from Ugo Bardi, showing the base mechanisms behind the World 3 model: there is a stock of resources that is used to build a stock of capital that in its turn allows for the procurement of the resource in a usable way by the economy. Since the resource is limited, extraction initially goes up, reaches a peak and then declines, reproducing the classical logistic model proposed by Verhulst in the XIX century and applied in the XX century by Lotka and Volterra. The main criticism to this model is that it all depends on the resources’ stock and a proper assessment of its extent. In reality this is very hard to do and it is easy to make an erroneous estimate.
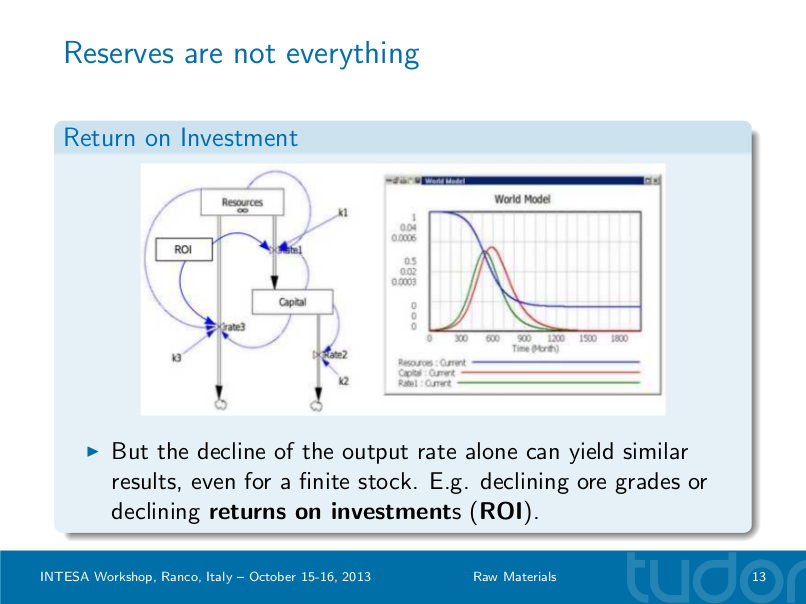
Let us then assume that this particular resource is infinite. If instead the efficiency of the process by which the resource is procured is declining, i.e. that the return on the capital invested declines with time, eventually the same kind of logistic growth and decline takes place.
This is akin to the fruit tree metaphor. We start with the low hanging fruit and then go up the tree taking the fruit in higher branches. The tree can be infinitely tall, rise up to the skies, but there will be a moment when it takes more energy to climb the tree than the energy the fruit provides.
3. The Supply curve
Let me now put this into an economic perspective.
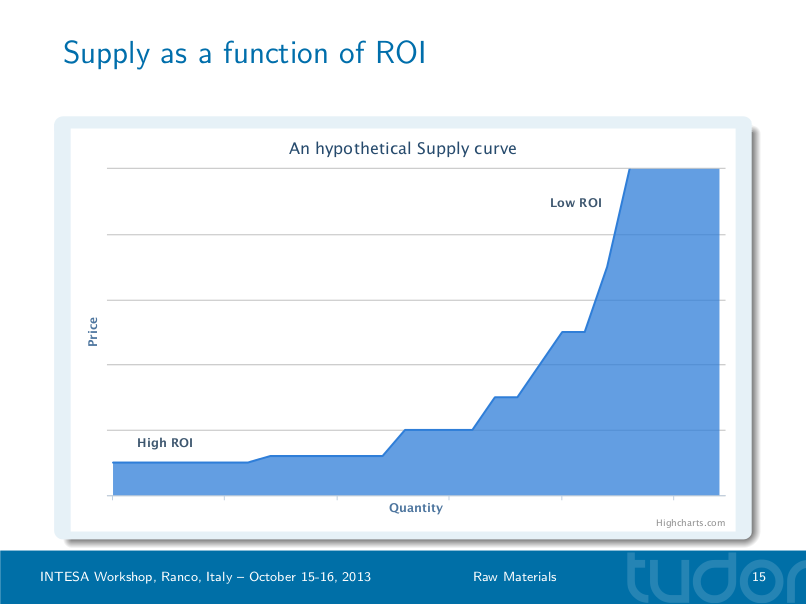
This is an hypothetical supply curve for some raw material. It can be described as a function of ROI, at the right we have the low hanging fruit, say shallower mines, that can provide large quantities for a low price. To provide larger quantities of the material the price has to be higher as we move towards lower ROI resources, say deeper mines or lower ore grades. And as we move to the left the steps to the following ROI grade become steeper, producing the typical shape of the supply curve in economics.
There are two basic dynamics that produce the sort of price rises we have witnessed the past decade.
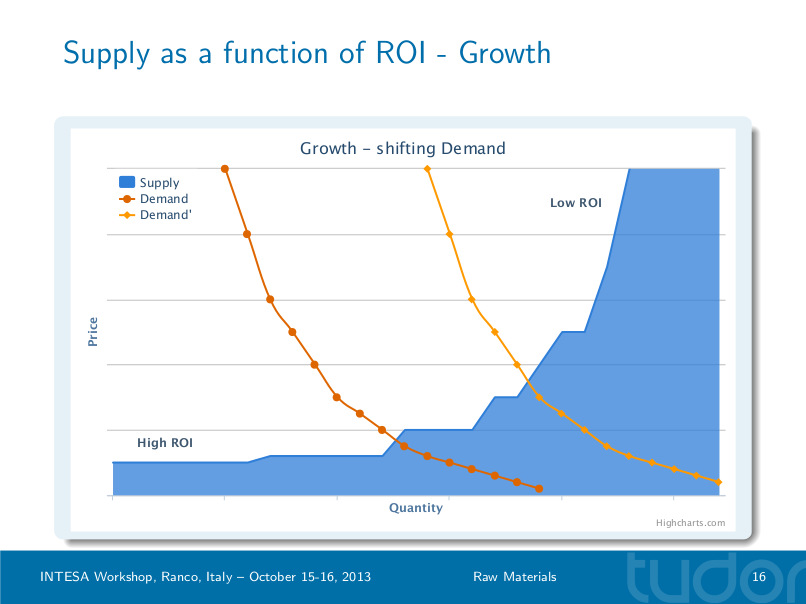
In first place is the classical expansion of demand. As the economy grows larger flows of raw materials are required, translating into a rightward shift of the demand curve, penetrating into lower ROI territories, forcing relevant price hikes. This is the case we see with raw materials like coal or silver. Note that those able to supply the low hanging fruit start to make much more money without doing anything different, they can even reduce the quantities supplied and still make larger gains.

A second dynamic is a leftward shift of supply, the consequence of a reduction in the quantities that can be sourced from the low hanging fruit. Demand may be stable but to procure similar quantities of the resource higher prices become necessary. This is also known as depletion, and is the main reason behind the price rises of raw materials like gold or petroleum.
4. A new resources market
The price movements of the last decade are giving rise to a rather different resources market, with somewhat different rules.
The POLINARES project was an unprecedented research effort funded by the European Commission through the 7th Framework Programme to assess these matters. It counted in its partners some of the top universities in Europe, plus the BGR and Enerdata. The results mark a major progression in the way raw materials are thought of in Europe.
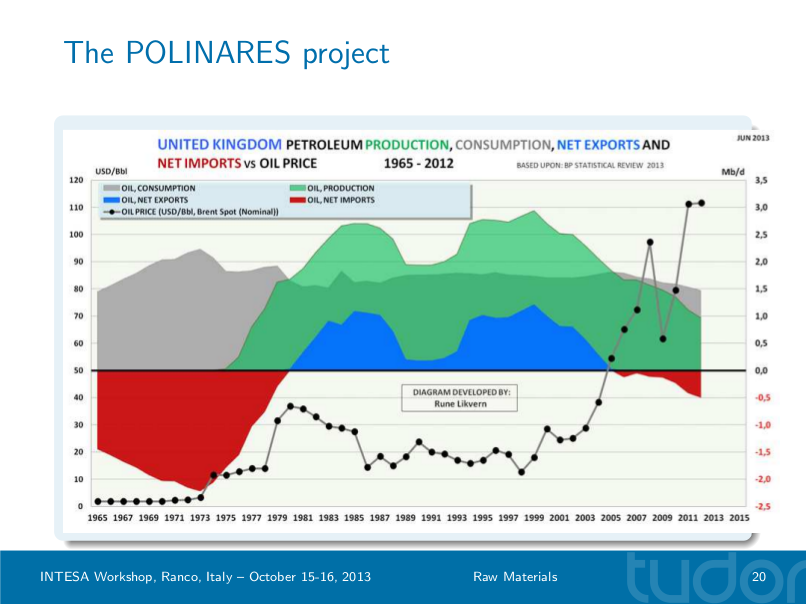
There is a reason for the rise of what the POLINARES partners termed state capitalism. This is a graph of petroleum consumption (grey) and production (green) in the UK, plus net imports (red) and net exports (blue). It is remarkable to see that the UK was a net exporter during a time of relatively low prices and became again a net importer precisely when prices started rising up again. Naturally countries rich in raw materials look at this and think: "we won’t do it this way". And of course, since they are now making much larger monetary gains it seems easy to restrain extraction, especially for those that possess the "low hanging fruit".

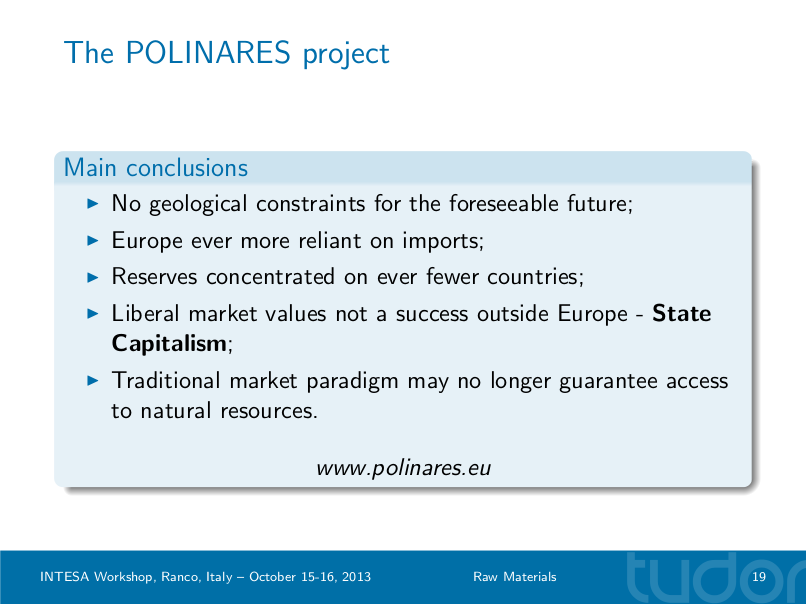
These are some of the most important recommendations of the POLINARES project; again a new perspective on these markets is laid out that can only be acknowledged as an important progression.
Policy suggestions
I’ll finally look into the future, but contrary to the goals of the workshop, I won’t provide scenarios, I’d rather lay out some policy suggestions that should steer Europe towards sustainability. I’ll start this exercise with two important observations.
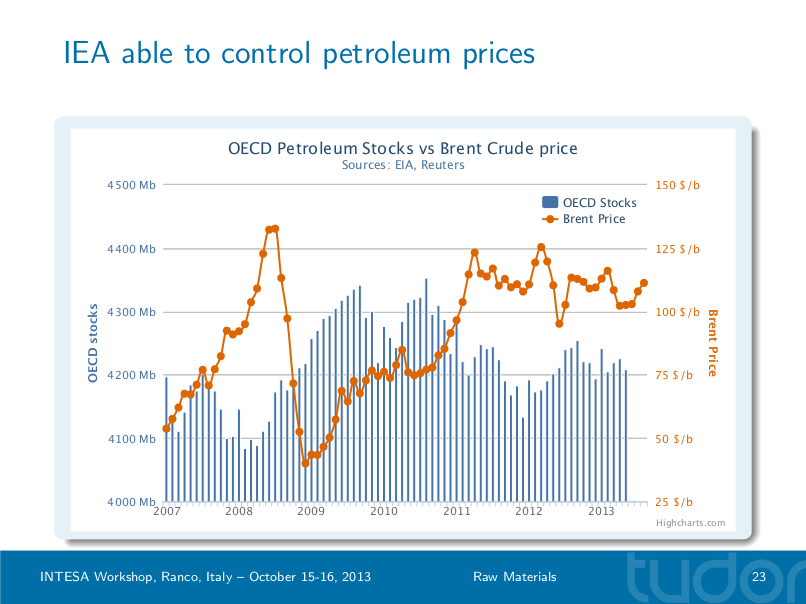
This graph shows in orange the Brent petroleum price index since 2007 and in blue the volume of the stocks held by OECD members during the same period. It is interesting to observe that to each price peak corresponds a low in stocks; conversely, each period of low prices is matched with stocks building up. It seems apparent that the IEA (who coordinates these stocks) has been buffering petroleum prices between 100 $/b and 125 $/b, producing a stable plateau since late 2010. This action has been instrumental in bringing online marginal petroleum resources such as the deep-water pre-salt plays off Brasil, tight oil in the US or the tar sands in Canada.
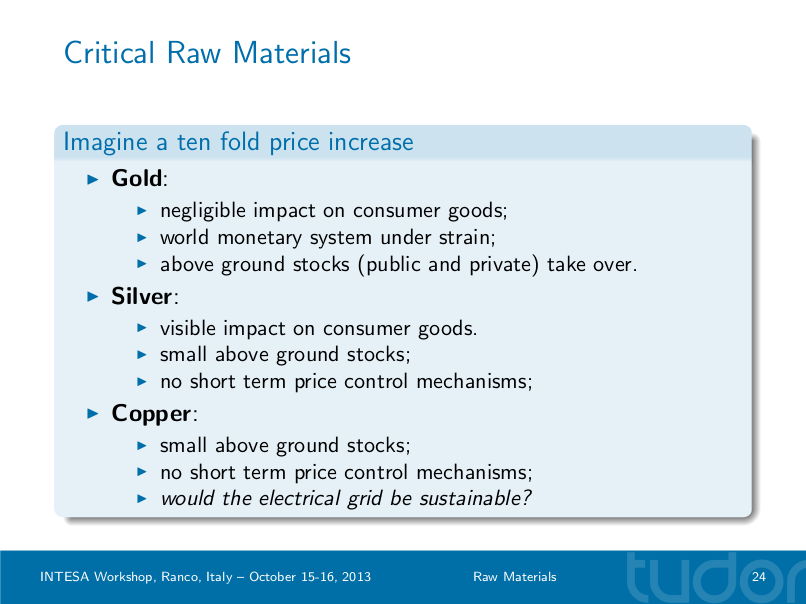
Secondly I’d like to make an exercise with you. Imagine that the price of the following raw materials increases tenfold. What would happen?
Gold – its industrial usage is marginal, hence we would hardly see any impact on our daily lives. But gold is a monetary metal, such a price hike would certainly push a liquidity run, bringing the monetary system under strain. Luckily there are plentiful above ground stocks (almost 100 times annual mining) that would provide short mechanisms to tackle monetary instability.
Silver – the above ground stocks of this metal are equivalent to only about one year of mining, almost exclusively privately held. In practice no short mechanisms exist to absorb such an hypothetical price shock. This metal has a broad range of industrial applications and we’d certainly see the price of some finished products going up: from electronic devices to solar panels, even in clothing. But overall it wouldn’t be dramatic.
Note here that I’m intentionally neglecting the risk of silver triggering a liquidity run, since it is too a monetary metal. That would be the theme for another address altogether.
Copper – again there are no obvious short term mechanisms to tackle a price shock. But in the case of this metal the consequences could be quite different since it is the backbone of our electrical grid. How could the grid be maintained and secured sustainably if copper prices became markedly more extensive than today?
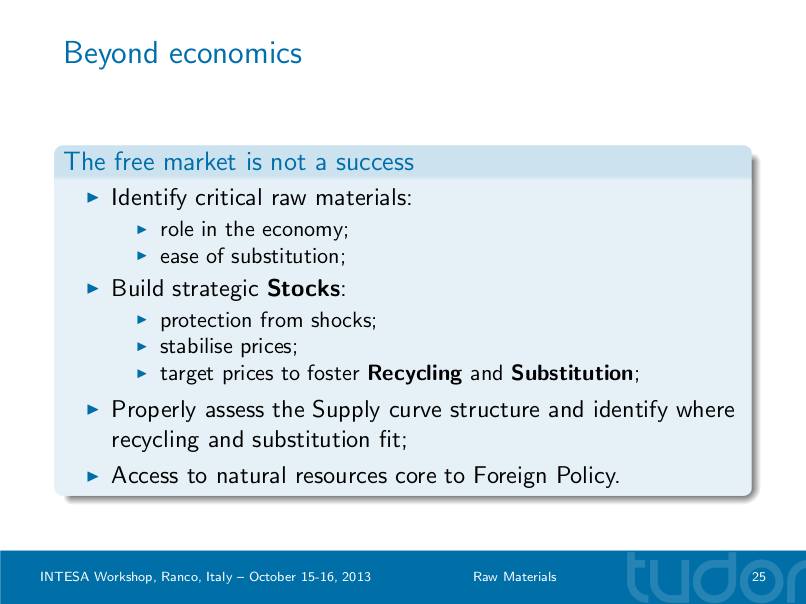
These policies I suggest point into directions that may not make economic sense according to standards, but try to provide resilience mechanisms for our economy.
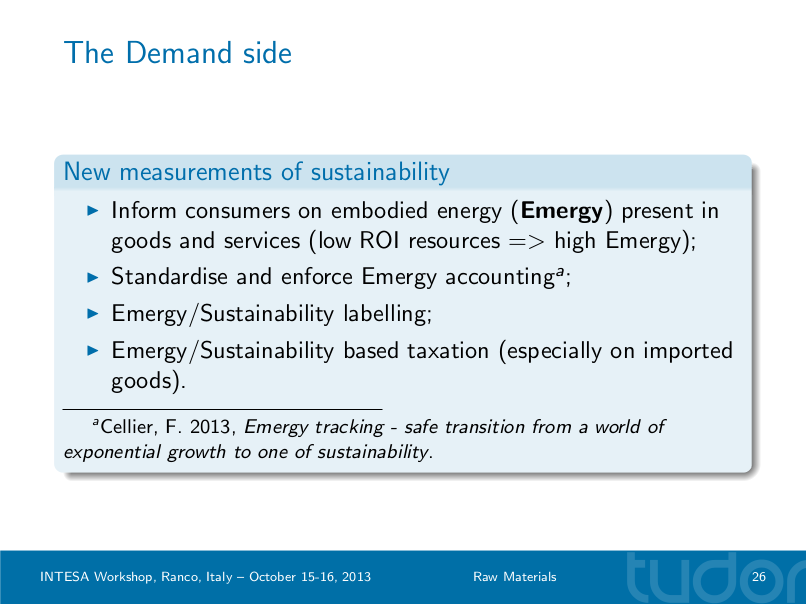
And there are also things we can do from the demand side. Consumers should start getting feedback on their choices, not only on the energy spent by goods during their lifetime but also on the capital and resources spent on its manufacturing cycle.
This slide proved controversial since the concept of Emergy used by François Cellier seems to not entirely match the concept endorsed by the Emergy Society. In any case, the idea is to have a thorough methodology to tag each product and service with a sustainability label.
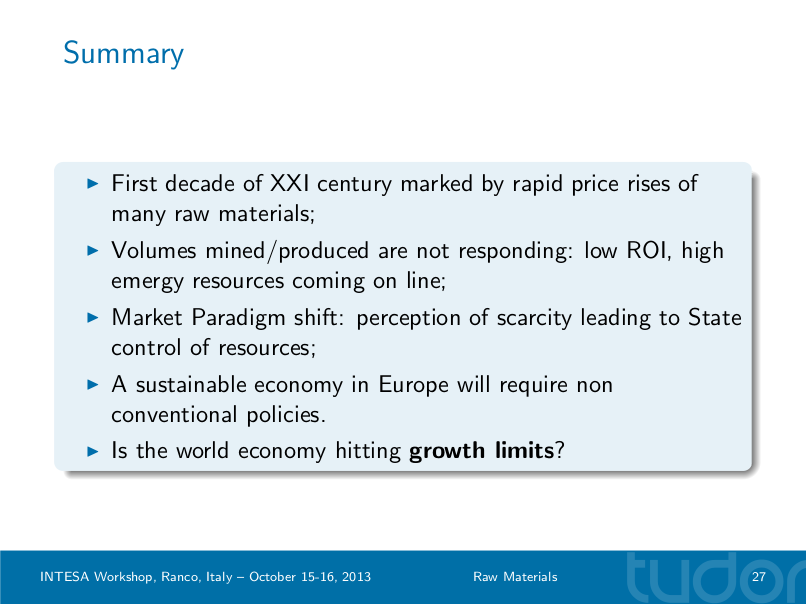
Summary

This book is the reason why I was invited to this workshop. "Der geplünderte Planet" (German for "The plundered Planet") provides a much wider and detailed account of our usage of raw materials; I am the author of a chapter on precious metals. An English language version should be published in the following months.
Q & A
The Q & A provided some further reflection worthy of report.
I didn’t choose gold, silver and copper by chance, these are the most conductible metals known to man. Returning to the hypothesis of a price spike of copper we can see with this graph the options available for substitution:
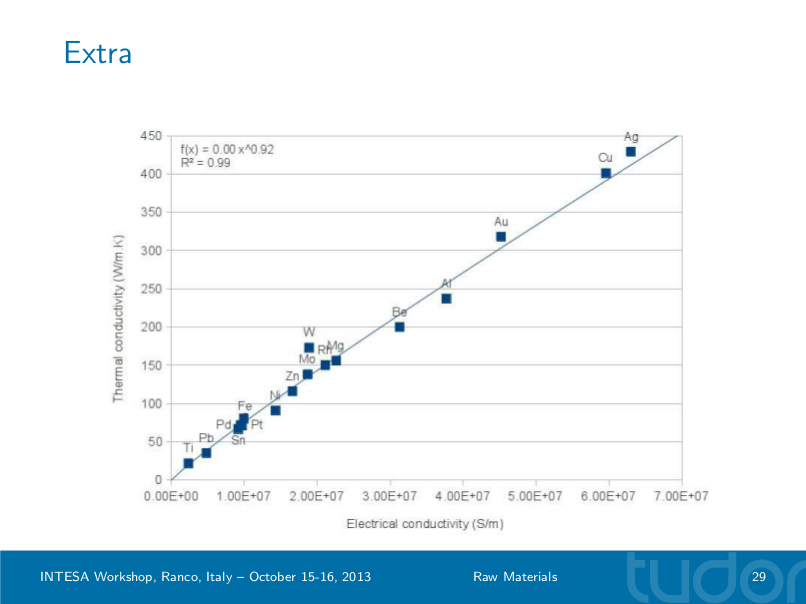
Silver is the most conductible metal known (hence its multitude of applications) with copper close behind. Silver is muchmore expensive and rare, thus it is not an option for substitution, thus we would have to look down in that scale. Next comes gold, and although its price is 60 times that of silver we already lost a third of conductibility. The first metal in this scale that seems able to replace copper price wise is aluminium, but at a loss of almost half of the conductivity.
I don’t exactly have answers to such a situation, hence the suggestion of non conventional policies like building strategic stocks. There’s no guarantee that a wide substitution of copper in the economy is possible in a practical way.
Regarding the labelling suggestion, and correcting the reference to Emergy perhaps to Exergy, the question is if it would produce any sort of consumer behaviour change given that prices are the primary choice factor. We can perhaps look at the successful introduction of biological agricultural products in Europe, some sort of sustainability conscience is rising among consumers that should be fully siezed. But a sustainability label is primarily a governance tool, providing further policy options to steer consumer patterns, taxing being just one.
Finally someone asked if among the ways I propose to bypass the traditional markets to procure raw materials, military intervention would be included, given that other powers may compete with Europe. That wasn’t exactly the idea, recent events with Iran show how it can take place, with the Islamic Republic convening with Turkey the direct exchange of petroleum for gold. Beyond that, I’d also note that in some cases Europe would actually be better off had it stayed away from military action. Libya is possibly the best example, the knee jerk action that turned Colonel Gaddafi from friend to foe overnight produced a chaotic situation for which a military solution may be the only one. At least the re-emergence of the three states that created Libya might be necessary for any sort of normality to return to the region.
Personal thoughts
I’m quite glad to have participated in this workshop. I learnt that resource scarcity is generally not included in models used to develop sustainability policies. Sustainability is composed by three pillars: environment, economy and society, but so far research has focused mainly on the first. My presence, among other folks, intended to provide an alternative view on what it may take to transition our economy to a sustainable future.
Things warmed up a bit between the resources folks and the environment side, but I must acknowledge that there is a serious effort to consider resource scarcity in these models (one presenter even had a picture of Jean Laherrère in his slides). INTESA is assembling an ambitious (but I hope useful) modelling framework for sustainability policiy that will include resource scarcity. I further learned that the Commission has already been working towards the identification of critical raw materials.
In the end, more than forecasting the future, the important thing is to identify the policies that can provide mitigation on one pillar without increasing risks on the other two. It will be by building bridges and finding overlapping policies that progress will be made.
The landscape provided by the Lago Maggiore is nothing short of breathtaking, perhaps helping with the abstraction needed to tackle the issues discussed.