(This article is an excerpt from Richard Heinberg’s book Snake Oil: How Fracking’s False Promise of Plenty Imperils Our Future.)
 Oil is the linchpin of our modern industrial way of life. Nearly all energy used for transport derives from it, and transport is essential to virtually all trade. Take petroleum away and the global economy would shudder to a halt in a matter of minutes.
It wasn’t always this way. The petroleum age started when the first commercial oil well was drilled in the late 1850s, and it wasn’t until the early 20th century that energy-dense, easily portable “rock oil” found widespread use.
With automobiles, airplanes, tractors, chainsaws, diesel-fueled trains, oil-powered ships, and diesel-powered mining and road-building equipment, it became possible to intensify and expand nearly every extractive and productive process known to humankind—including the process of drilling for oil. Agriculture, fishing, mining, transportation, manufacturing, and trade burgeoned as never before, lifting billions from poverty (or undermining their more sustainable traditional ways of life, depending on how you look at it) and providing several hundred million humans with a level of amenity, convenience, and mobility undreamt of even by the pharaohs and emperors of previous eras.
All these benefits have come at a cost. The growth of extractive industries has led to increasing rates of depletion of minerals, soil, water, fish, and forests. At the same time, the expansion of industry has created burgeoning streams of waste products that nature cannot absorb. The most pervasive of industrial wastes is carbon dioxide, released when oil and other fossil fuels are burned. As ambient levels of carbon dioxide rise, the planet’s atmosphere traps more heat, changing the climate and precipitating extreme weather events, potentially leading to conditions in which civilization cannot persist.
Resource depletion and climate change are problems that undermine the survival prospects of future generations. Many people still tend to think their impacts are decades away, but we are beginning to see those impacts unfold in real time all around us.
In this chapter, we will take a whirlwind tour of a controversy that has roiled the oil and gas industry for the past decade and more. The discussion about oil supplies, reserves, and production that goes by the name of “peak oil” is complex and subtle and has often been mischaracterized or ludicrously oversimplified (“We’re running out!” versus “We’re not running out!”). It is a discussion that readers must be familiar with in order to properly understand and evaluate the claims of abundance currently being made by representatives of the fossil fuel industry. What follows is intended both as an overview of the current state of that discussion, and as an effort to set the record straight with regard to economic life-or-death issues that have sometimes been distorted by those who profit from our fossil-fueled status quo.
PEAK OIL: WHAT THE FUSS IS ABOUT
Individual oil wells have a finite life span. Sometimes aggressive techniques—such as water flooding—can be deployed to extend an oil well’s life, but depletion is inexorable, and eventually every oil well reaches the point where production rates decline severely and the cost of extraction efforts exceeds the value of the oil being extracted. When that happens, the well is capped or plugged with cement, and equipment is removed from the site.
The same principle holds for larger aggregations of petroleum resources. When a new oil field is discovered, a few exploratory wells are drilled to help determine the size of the deposit and the nature of the geology. With this information, engineers determine optimum well placement and start drilling in earnest. The production rate for the oil field increases as more wells are drilled. Gradually, as older wells deplete, their production rates begin to decline, but new wells are drilled to offset those declines. Eventually, when all of the possible drilling locations have been used and production from most wells is tailing off, it becomes impossible to stave off the dwindling of the overall extraction rate.
Bundle many oil fields together and again the same principle holds. At this level of scale a pattern becomes apparent: the aggregate oil extraction rate begins to approximate a bell curve. The top of the curve represents the maximum production rate, or the peak of oil production, for the fields in question.
Most oil-producing countries—including Indonesia, the United Kingdom, Norway, and the United States—saw their national peaks in crude oil production years or decades ago. Their production declines have been offset by discoveries and production growth elsewhere in the world.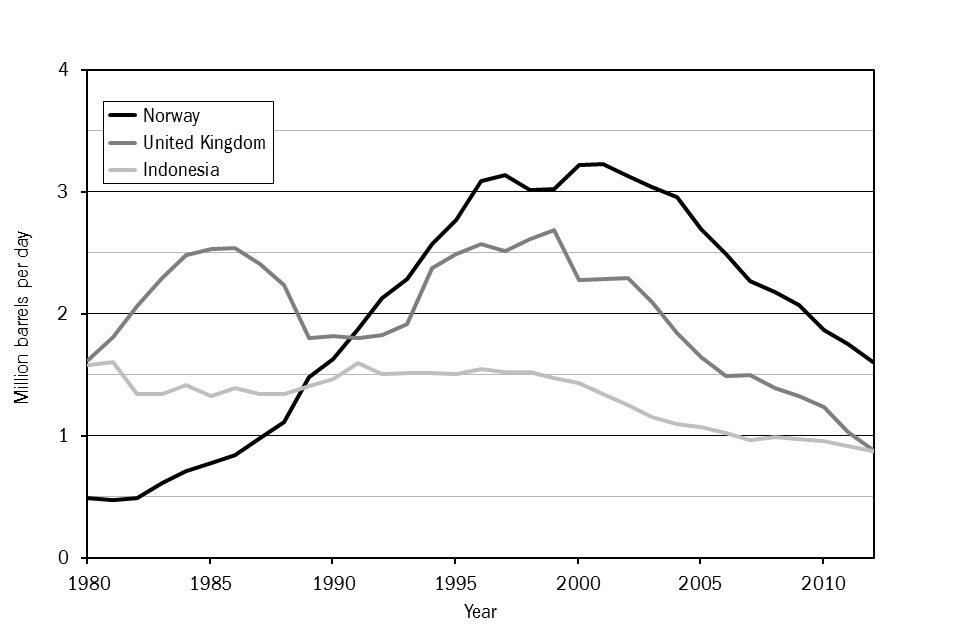
Figure 8. Norway, UK, and Indonesia Oil Production, 1980–2012.
Source: Energy Information Administration, May 2013.
But there are only so many potential oil-producing areas on our small planet. Therefore, the same peaking trend will inevitably hold for the entire world. The rate of global oil production will rise to a plateau or peak, then decline. Unless we have somehow substantially reduced our dependency on oil by the time that decline commences, the impact to the global economy will be serious-to-catastrophic. Therefore the timing of peak oil is of great importance.
And that’s what all the fuss is about.
OKAY, WHEN?
Oil analysts have two main ways of forecasting the timing of the global peak. One involves applying a fairly simple equation to past and current production statistics; the other is a more detailed method of adding likely flows from potential new sources and subtracting declines from existing fields (which number in the thousands). Neither method is foolproof. The data are too complex to permit the accurate forecasting of the global oil production peak to the day, month, or year. But many analysts agree that around 2005, as global crude oil production hit a plateau that continues to the present, our world entered the peaking period, and within a few years the global oil production rate will in all probability start to decline.
Here are some of the factors that complicate efforts to forecast the peak:
Reserves and resources. Some analysts (in the Introduction we called them “Cornucopians”) are highly optimistic about oil’s future. They typically point to enormous reserves of oil around the world, which continue to grow—for reasons discussed below. If there’s all that oil left to extract, they ask, does it make sense to worry about an imminent peak in production rates?
Peakists reply that focusing on reserves numbers can be misleading, as not all oil is the same. Saudi oil, most of which was discovered in the 1950s and 1960s, can be produced cheaply and quickly; the oil being brought on line now from tar sands, deepwater, and tight formations will either be extracted slowly, or will require high levels of investment, or both.
Sometimes reckless oil boosters confuse reserves (defined as the portion of the total hydrocarbon endowment that is extractable at realistic market prices and with current technology) with resources—the total endowment. For example, the Green River shale formation in Colorado represents a resource base equivalent to roughly a trillion barrels of oil. If all those resources were to be counted as reserves, the United States would instantly leap to the top of the list of oil-bearing nations. However, with current technology and at current market prices, virtually no oil is being commercially produced from the Green River formation, and that situation is not likely to change anytime soon. (We’ll see why in Chapter 6.) The point cannot be overemphasized: the peak oil discussion is about rate of supply, not size of resources or even reserves.
New discoveries. Cornucopians often trumpet new oil discoveries, such as ultra-deepwater finds off the coast of Brazil, as undermining the notion of near-term global production peak. This would be the case if the rate of discovery of new oil sources were increasing (but it is not) and if the amount of new oil being discovered annually exceeded the amount being extracted from known fields annually (it doesn’t, by a long shot). The peak rate of discovery, when many large fields were being found each year, occurred globally in the early 1960s. In recent years the oil industry has found (on average) one barrel of new oil for every four or five consumed.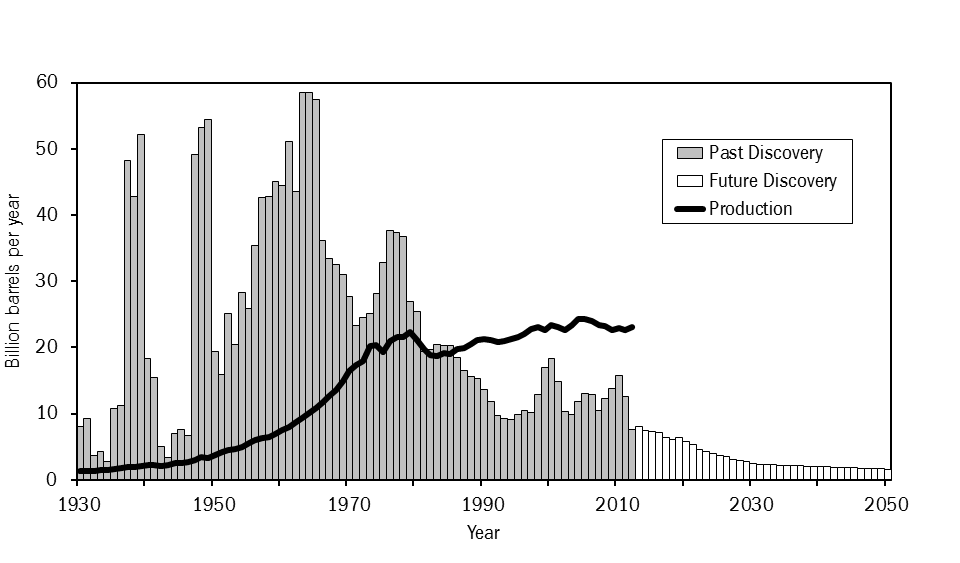
Figure 9. World Conventional Oil Discoveries and Production, 1930–2050.
Source: Colin Campbell, Association for the Study of Peak Oil, 2012.
Cornucopian analysts insist once again that declining discoveries are not a problem because world oil reserves are increasing. However, some of this growth in reserves is illusory. In March 2012, Sir David King’s team at Oxford University’s Smith School of Enterprise and the Environment published a peer-reviewed paper in Energy Policy, concluding that the industry had overstated world oil reserves by about a third.1 Most of the rest of recent reserves growth has come from reclassification of marginal resources. This has happened partly because of refinements in production technology, but mostly because oil prices have risen high enough to justify the enormous investments required to extract and process tar sands, heavy oil, and tight oil. The upshot: as reserves of regular conventional oil are consumed, they are being replaced by reserves of oil or bitumen that will be produced more slowly, at higher cost, with higher environmental risks, and with the requirement for larger investments of energy into the process of production.
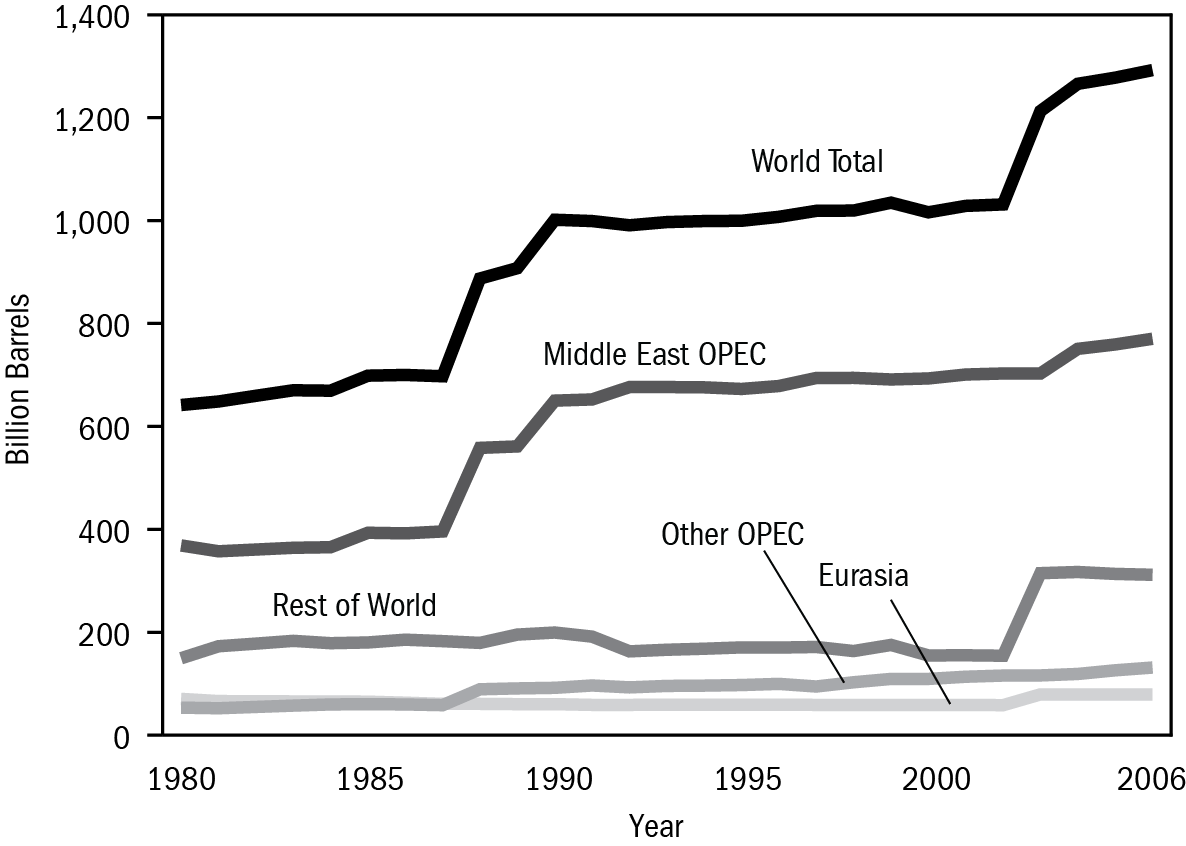
Figure 10. World Declared Oil Reserves, 1980–2006. Reserves include crude oil (including lease condensates) and natural gas plant liquids. Most upward revisions come from OPEC claims of new reserves (whose validity is hotly debated) and reclassification of tar sands and extra-heavy oil deposits as oil reserves.
Source: Energy Information Administration, International Oil Outlook 2006.
When a new source of supply comes on line it must first replace declines from existing fields before it can help boost overall production to a higher level. For the world as a whole, the rate of decline in production from existing oil fields is between 4 and 5% annually.2 Thus, every three years the world needs to find brand new sources of oil that, taken together, are as productive as Saudi Arabia just to maintain a constant overall rate of production. For the past seven years, the global oil industry has been able to maintain a rough balance between declines and increases, but doing so has required substantially increased rates of drilling and capital expenditure.
Wild cards. The likely timing of the commencement of the inevitable global oil production decline will be determined not just by geology, but also by wild cards like technology, politics, and the economy.
Technology can make oil accessible that wasn’t previously (as is the case of tight oil, which we will discuss in Chapters 2 and 3). On the other hand, political events can take oil production off-line rapidly, as happened in the 1970s with the Arab oil embargo, and as is occurring today with US sanctions against Iranian oil exports. At the same time, the condition of the economy affects oil demand: if the economy booms, demand goes up, and that leads to higher oil prices. Higher prices then stimulate efforts to produce oil that was previously uneconomic. If the economy falters, the price of oil drops and so do efforts to produce marginal sources.
Defining “oil.” Another complication arises from the definition of the word oil. Does it refer only to conventional crude? When the US Energy Information Administration (EIA) releases statistics for current or future US oil production, the numbers always include refinery gains. When oil is refined, the volume of the products yielded from it (as measured in barrels or cubic meters) is greater than the volume of the crude oil that entered the refinery because the refined products are lighter and less dense than crude. Yet refining oil into gasoline, diesel, and kerosene requires energy—thus energy has been lost in the process, even though product volume has increased. Moreover, in the EIA’s “oil” production statistics for the US, refinery gains for imported oil are implicitly lumped together with volumetric gains from the refining of domestically produced oil, thus making it seem as though the nation is producing more oil domestically, and importing less, than is really the case.
Further, the International Energy Agency’s definition of “oil” includes natural gas liquids (or NGLs). Natural gas is mostly methane, but as it comes out of the ground, it may also contain hydrocarbons with longer molecular chains, including propane and butane. These are typically captured in processing and used for heating and for industrial purposes, including the making of plastics. They are called NGLs not because they are liquid at room temperature and normal atmospheric pressure (they’re not), but because they can be liquefied at lower pressure and higher temperature than methane and are typically bottled and sold in liquefied, pressurized form. (NGLs are not the same as liquefied natural gas—or LNG—which is methane that has been super-cooled and highly pressurized, usually to make it easier to transport by tanker.) NGLs have only about 60% of the energy by volume as crude oil and are, for the most part, used for purposes different from those of crude oil. So why should NGLs be called “oil”?
Then there are biofuels. These are used for purposes similar to those of crude oil—principally, as transportation fuels. However, ethanol and biodiesel are not extracted from the ground; they are made from agricultural products in a process that requires lots of oil and natural gas. Their production uses so much energy, in fact, that it is questionable whether they provide a net energy benefit, and, in any case, counting the biofuels along with the fuels that are consumed in their production is an improper double-counting.
When official agencies call NGLs and biofuels “oil,” statistics then show world “oil” production increasing in recent years; when these substances are subtracted from the accounting, nearly all that growth disappears. Thus an important economic signal is often hidden behind statistical noise.
All of this makes it more difficult to answer the question, “When will world oil production begin to decline?” Yet the question loses none of its criticality. Even if forecasting the exact date of the peak is a fool’s errand, only a fool would miss the signs that the world oil industry has entered a new, desperate era. Discoveries are down, costs are up. Production has flatlined, environmental impacts from petroleum operations are soaring.
Is this what peak oil looks like?
IT GETS WORSE
The actual peak in world oil production will presumably occur over the course of several years, while the decline in production will continue for decades. Given so much time, one might assume that civilization will gradually adapt without too much stress and strain. Two dilemmas make this much less likely by reducing the time available for adaptation.
The first is the net export dilemma. Trade in petroleum is integrated and global. Enormous amounts of oil are shipped by tanker from continent to continent or flow from country to country via pipeline. Many nations (such as Japan) produce no oil and import all they use, while others (like Saudi Arabia) are substantial exporters of petroleum. As the price of oil rises, the revenues to oil exporting nations grow (Saudi Arabia makes more money)—and economic expansion within these nations brings more domestic demand for oil. Thus, exporting nations end up using more of their own oil and exporting less, even if production holds steady from year to year. Indeed, oil demand within Saudi Arabia is growing faster than in all but a few other nations.
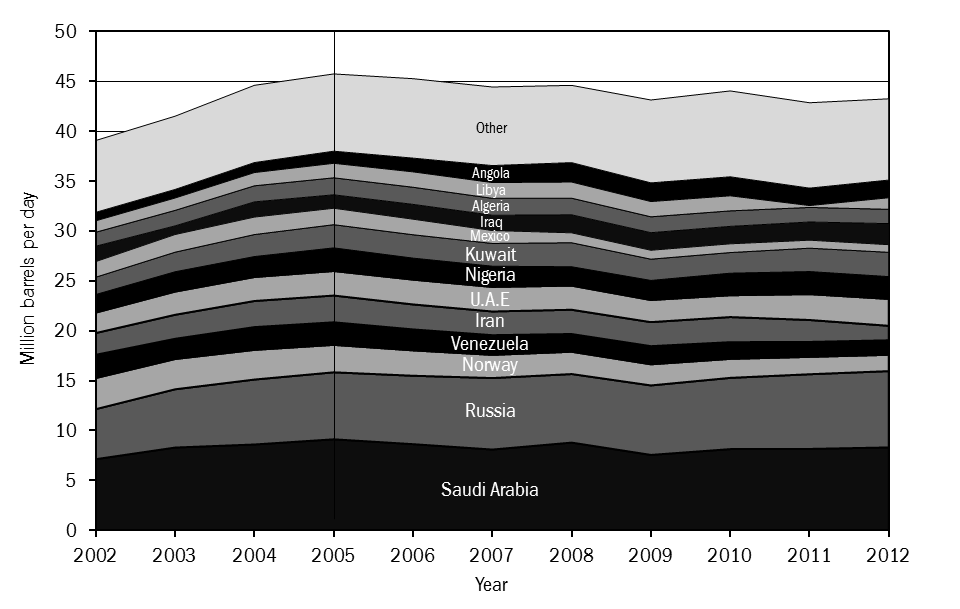
Figure 11. Oil Net Exports of Top 45 Net Exporters, 2002-2012. Net exports have declined over 5% since 2005.
Source: Energy Information Administration, June 2013; compiled by Jeffrey Brown and Daniel Lerch.
Since 2005, as world crude oil production has stayed essentially flat, the amount of petroleum exported has declined by about 5%.3 Competition for these available exports has nudged oil prices higher. Because industrializing nations like China are able to afford a higher price (they haven’t spent decades getting used to using cheap oil in large quantities), they have effectively outbid older industrialized nations like the United States and most European countries: China imports more, while the US imports less. In the United States and Europe, high oil prices slow the economy, and in a slow economy motorists cut back on driving. Indeed, US drivers have cut back on gasoline consumption. As peak oil blogger Gail Tverberg has noted, American oil consumption in 2012 was about 20% lower than it would have been if the pre-2005 trend in oil consumption growth of 1.5% per year had continued.4 Some of this reduction is as a result of improved vehicle fuel efficiency, but Americans are also simply driving less.5
If this trend toward declining petroleum exports continues, and there is no persuasive reason it won’t, then the amount of oil available on the world export market will shrink rapidly over the next decade. Oil importing nations will increasingly be shut out, and older industrialized nations (the United States, Japan, and Europe) will bear the brunt of disappearing export volumes. Petroleum geologist Jeffrey Brown calculates that if current trends were to persist, the United States and Europe would effectively be shut out of the world petroleum export market by 2025.6
A second dilemma, the decline in the energy returned on the energy that’s invested in obtaining oil, will ultimately affect importers and exporters alike.
It takes energy to get energy. In the glory days of the oil industry, investing a barrel of oil’s worth of energy in exploration and production yielded a hundred barrels of oil or more over an oil well’s lifetime. Today in the US oil patch, the ratio of energy yield to energy investment is closer to 10:1.7
Clearly, when the overall energy return on energy invested (EROEI) for the process of oil extraction declines to 1:1, then the oil produced will cease to be an energy source in the true sense. It may still be useful as raw material or lubricant, but it will no longer serve to increase the amount of net energy available to do work for society.
The math of EROEI reveals what has come to be known as the net energy cliff. At first thought, it might appear that a 100:1 EROEI is 10 times more beneficial to society than a 10:1 energy profit. But it turns out that there’s a practical turning point at around 10:1 (the cliff). Above that ratio (from 11:1 to 200:1 and beyond) each incremental increase in EROEI delivers relatively smaller benefit. Below 10:1, each increment of decline is much more decisively detrimental.
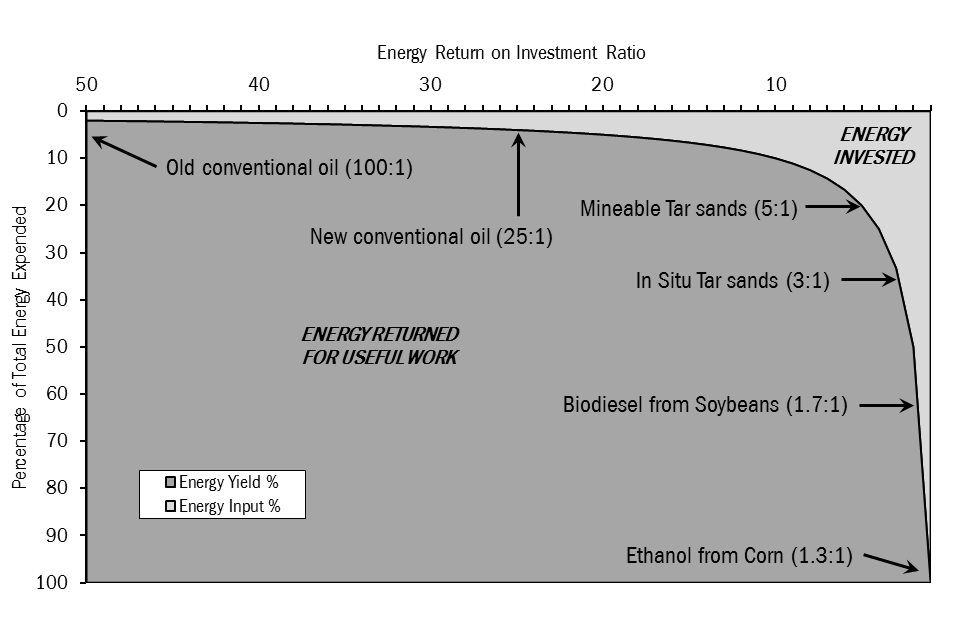
Figure 12. The “EROEI Cliff.” This chart shows the energy available to do useful work as a proportion of total energy expended for various resources.
Source: Adapted from J. David Hughes, “Drill, Baby, Drill,” Figure 38.
Think of net energy in terms of the number of people in society engaged in energy production. If EROEI = 1:1, then everyone is involved in energy production and there is no one available to take care of society’s other needs. If the EROEI is 100:1, then 1 person is involved in energy production and 99 are able to do other things—build houses, teach, take care of the sick, cook, sell real estate, and so on. If we have 2 energy workers and 98 folks doing other things, then EROEI = 50:1; similarly, with 4 folks getting energy and 96 doing other things, EROEI = 25:1. With 8 getting energy and 92 doing other things (EROEI = 12.5:1) there may begin to be problems finding enough folks who are trained at getting energy to provide for all the others, whose every activity uses energy. With 16 getting energy and 84 doing other things (EROEI = 6.25:1) serious problems may become apparent, and an industrial-style organization of society may be only marginally viable.
Agriculture, education, health care, defense, entertainment, transportation, and manufacturing are all users of energy. A modern industrial nation needs a big surplus of energy from its energy-production efforts in order to power all these enterprises. White’s Law, arguably as important in the field of human ecology as the laws of thermodynamics are in physics, states that the level of economic development possible in any society is determined by the amount of net energy available per capita.8 We ignore EROEI at our peril.
EROEI is crucial to considerations of the potential economic benefits of tar sands, oil shale, and biofuels, because each of these fuel sources has an EROEI of 5:1 or less. Their production can be financially profitable in certain economic and regulatory environments: government subsidies support the production of ethanol, gullible investors can sometimes be persuaded to fund the production of marginal resources like oil shale, and high oil prices can create incentives for the expansion of tar sands operations. But by themselves—if we were to remove the contributions of energy from conventional oil, gas, coal, hydropower, wind, and solar and ramp up tar sands, oil shale, and biofuels instead—these energy sources would be unable to power a complex society.

Figure 13. Characteristics of Energy Resources.
Source: Data compiled by David Murphy, from Tom Butler and George Wuerthner, eds., ENERGY: Overdevelopment and the Delusion of Endless Growth, (Healdsburg, CA: Watershed Media, 2012).
Since the EROEI of oil is declining rapidly due both to the depletion of easy-to-produce deposits and to the increasing use of tar sands and tight oil, it would seem sensible for energy policy makers to promote an equally rapid transition to wind and other energy sources that have higher energy returns. However, in reality, renewable energy sources are making only small and slow inroads except in a very few countries (such as Germany and Denmark). That’s partly because of the political influence of the fossil fuel industry, but it also results from our enormous sunken investments in the current energy infrastructure of highways, internal combustion engines, gas furnaces and stoves, natural-gas-burning power plants, and so on. Replacing these takes time and money. These sunken investments ensure we will probably continue using oil and gas for decades, despite their deteriorating economics.
Can technology solve the EROEI problem? New ways of extracting oil and gas could increase the energy efficiency of the process. For example, pad drilling and increased rig mobility have enabled drillers in the Eagle Ford formation to reduce average drilling time from 23 days in 2011 to 19 days in June 2012. Reduced drilling time almost certainly translates to reduced energy investment. However, efficiency efforts must push against the tide of declining resource quality: overall, tight oil plays require more energy investment in drilling than conventional oil plays, and as the best resources in those plays are drilled first, each new well requires more effort per unit of productivity. (We will return to this topic in more detail in Chapter 6.)
The relentless decline in EROEI of oil is one of the biggest underreported economic stories of our times. Available net energy—what makes society work—is dwindling away even as production statistics seem to show a North American oil and gas production boom.
Add net exports and net energy together, and the situation, especially for industrialized oil importing nations, starts to look pretty severe even over the short term (from now to 2020).
MAKING SENSE OF HISTORY AS WE LIVE IT
From the start of commercial exploitation of petroleum in 1859 to roughly the year 2000, the inflation-adjusted (to year 2000) price of oil averaged roughly $20 per barrel in most years. A barrel of oil contains the energy equivalent of roughly 23,000 hours of human labor, so $20 per barrel translated to a minuscule energy cost as compared to the cost of the energy sources (principally, human and animal muscle-power) that had built the pre-20th-century agrarian world. The industrial cities of today were founded on ultra-cheap fossil energy. Parking lots were paved, bridges spanned, suburbs and highways constructed—all with a principal fuel source that cost only an insignificant fraction of the cost of human labor.
During the past decade, the yearly average price of oil has jumped to over $100 per barrel. Global annually averaged crude oil prices doubled from $25 in 2002 to $55 in 2005, and then doubled again, from $55 in 2005 to $111 in 2011. The energy of oil is still cheap when compared to the cost of human labor, but it has increased roughly 500% in comparison to its price during the 20th century, the heyday of industrial expansion. We are still wealthy compared to our ancestors; we still enjoy the benefits of cheap energy. Yet now, paving parking lots, spanning bridges, and constructing suburbs and highways costs significantly more than it did previously.
Alternative, renewable energy sources have the potential to replace oil in some applications. Still, the inevitable energy transition away from fossil fuels will take enormous investments, and it will also take time—three or four decades in the best case. It is therefore highly unlikely that society will make sufficient investment, in sufficient time, to avert a steep decline in available energy and a steep increase in energy costs during the coming decades.
The economy can adjust to higher energy prices over time, but that adjustment process may be painful. Since replacing oil with other energy sources will be difficult, and since oil is so pivotal to world trade, the decline of oil will probably ensure the commencement of a historic period of economic contraction—in some respects, a mirror image of the 20th century’s unprecedented boom.9 And that’s a fair interpretation of what we are beginning to see take place around us. Economic weakness plagues the world’s industrialized nations. Efforts to extract “extreme” fossil fuels have taken on an air of desperation. The oil-rich Middle East is in turmoil, with major world powers seeking either to buy influence with rulers or to gain control of resources by destabilizing regimes. Paradoxically, while labor productivity rose during the era of ultra-cheap energy as workers used powered machines to accomplish more tasks, rising energy costs now translate to higher unemployment and downward pressure on wages.
Much of our current economic dilemma has to do with debt—and this in turn also relates to the underlying energy problem. As American economist Robert Gordon has documented, cheap oil and electrification drove rapid economic growth during the mid-20th century.10 By the 1970s, the expansion of oil- and electricity-based infrastructure was reaching a point of diminishing returns in terms of its ability to keep the economy expanding: most families already had a car or two, as well as a houseful of electric appliances and gadgets. As globalization took hold, American factory workers found themselves competing with workers in poorer nations, and real hourly wages stopped growing. With demand stagnating, new ways had to be found to keep the engine of economic growth humming. Since the 1970s, growth in consumption has been maintained to an ever-greater degree simply by borrowing, with rising consumer debt as a significant driver of commerce. During this period in the United States, debt (all debt, not just government debt) rose at three times the rate of GDP growth. As debt ballooned, the financial industry increased in size relative to manufacturing, agriculture, and the other components of the economy. The financial industry then began blowing bubbles as a way of increasing profits. The most recent of these was the US housing bubble, whose collapse in 2007–2008 left us where we are now. The end of the era of cheap oil and the inflation and collapse of history’s biggest debt bubble are historically intertwined.
With energy literacy, an understanding of energy history, and a peak-oil-informed perspective, current economic and geopolitical events become much more readily understandable—if no less causes for concern.
DEPLETIONIST ECONOMICS
Standard economic theory says that peak oil should present no problem. If any resource that is in high demand becomes scarce, its price will rise until someone finds a substitute. After all, petroleum itself was initially a substitute for whale oil. If crude oil can no longer be produced at the rate at which the world wants to consume it, we will adapt. We’ll drive electric cars. We’ll burn biodiesel made from algae.
Yes, we will find substitutes for oil—at least in some instances. But there is no guarantee they will be superior, or even affordable. All the substitutes currently available are problematic in one way or another.
There’s a school of thought that says (in effect) that the more money we spend on energy substitutes, the better. If we spend lots of money on new energy sources (borrowing the money, if necessary), doing so will increase GDP—which is essentially a measure of how much money is spent in the economy. And a higher GDP is assumed to translate to a higher standard of living.
This line of thought may be misleading. While we tend to think of money as the prime mover of the economy, in fact it is energy that gets things done. More and cheaper energy translates to a more complex society with a growing economy; less energy, and more expensive energy, translates to a stagnant or shrinking economy that sheds complexity.11
Again, the primary implication of peak oil is an end to economic growth as we have known it during the past few decades. In order to adapt to peak oil, we will need not just different energy sources, but transformations in the ways we use energy. We will be less mobile and will need to adapt our trade dependencies and redesign our cities and our lives accordingly. We will need to rethink our food systems to make them more locally based and less dependent on petrochemical inputs. We will need a new economic paradigm in which growth is no longer the goal, one in which conservation of natural resources is a much higher priority than is currently the case.
In short, peak oil turns out to be a very real problem, and a very big one indeed.
* * *
All of the trends discussed above—the steep rise in oil production costs in recent years, the leveling off of world crude oil production rates, the economic pain that is resulting, and the implications for future economic growth—constitute the “game” that fracking is attempting to change. How much, and for how long, does it change that game? Let’s take a look at what has been accomplished and what’s been promised with this new technology.
—
This article is an excerpt from Snake Oil: How Fracking’s False Promise of Plenty Imperils Our Future by Richard Heinberg.
See also:
Introduction. A Front-Row Seat At the Peak Oil Games
Chapter 2. Technology to the Rescue
—
References
1.Nick Owen, Oliver Inderwildi, and David King, “The Status of Conventional World Oil Reserves—Hype or Cause for Concern?” Energy Policy 38, no. 8 (August 2010): 4743–4749, doi: 10.1016/j.enpol.2010.02.026.
2.International Energy Agency, World Energy Outlook 2008; see also http://www.postpeakliving.com/files/shared/Hook-GOF_decline_Article.pdf.
3.Matt Mushalik, “Shrinking Crude Oil Exports a Tough Game for Oil Importers,” Crude Oil Peak (blog), February 4, 2013, http://crudeoilpeak.info/shrinking-crude-oil-exports-a-tough-game-for-oil-importers. Mushalik references JODI Oil World Database data up to November 2012.
4.“Why Is US Oil Consumption Lower? Better Gas Mileage?” The Oil Drum (website), last modified February 6, 2013, http://www.theoildrum.com/node/9811.
5.“Annual Vehicle-Miles Traveled in the United States and Year-over-Year Changes, 1971-2012,” The Geography of Transport Systems (website), http://people.hofstra.edu/geotrans/eng/ch3en/conc3en/vehiclemilesusa.html.
6.Jeffrey Brown, “The Export Capacity Index (ECI): A New Metric For Predicting Future Supplies of Global Net Oil Exports,” ASPO-USA (website), February 18, 2013, https://www.resilience.org/stories/2013-02-18/commentary-the-export-capacity-index.
7.Megan C. Guilford et al., “A New Long Term Assessment of Energy Return on Investment (EROI) for U.S. Oil and Gas Discovery and Production,” Sustainability 2011, 3, 1866–1887, doi:10.3390/su3101866.
8.“White’s Law,” Wikipedia, last modified July 25, 2012, http://en.wikipedia.org/wiki/White%27s_law.
9.Gail Tverberg, “How Resource Limits Lead to Financial Collapse,” Our Finite World (blog), March 29, 2013, http://ourfiniteworld.com/2013/03/29/how-resource-limits-lead-to-financial-collapse/.
10.Robert Gordon, “Is U.S. Economic Growth Over? Faltering Innovation Confronts the Six Headwinds,” The National Bureau of Economic Research, NBER Working Paper No. 18315, August, 2012, http://www.nber.org/papers/w18315.
11.Gail Tverberg, “How High Oil Prices Lead to Recession,” Our Finite World (blog), January 24, 2013, http://ourfiniteworld.com/2013/01/24/how-high-oil-prices-lead-to-recession/.
Image credits: Fracking the Roan Plateau – Ecoflight, Container terminal – alessandro_tortora/flickr