This is a guest post by Seismobob. His real name is Glenn Morton, and he works in oil exploration in the oil industry.
With BP’s Deepwater Horizon blowout in the news, the world’s interest is now focused on deepwater oil production. BP has another deepwater platform in the Gulf of Mexico—Thunder Horse—where it has been working some for some time. My analysis suggests production is not going well as planned at Thunder Horse.
Thunder Horse field created huge excitement when it was discovered in 1999 in Mississippi Canyon blocks 788 and 822. Partners BP and Exxon announced that the field had a billion barrels of reserves. After nearly two years of production history on the field, it is becoming obvious to most outside observers that Thunder Horse field is not performing as it was expected to perform, if one is to believe the press accounts and specifications of the production facilities. If the field is underperforming, as the data available from the Minerals Management Service seems to indicate, this should be of concern and interest to those in the Peak Oil community, and to the world.
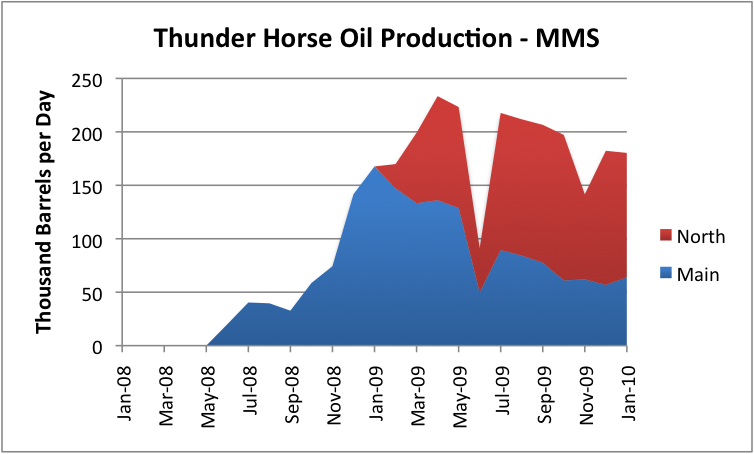
Thunder Horse was designed with an oil production capacity of 250,000 barrels a day. Clearly, it never hit that level, and seems to be already declining. If the field really had a billion barrel of producible oil reserves, it would take 11 years of production at 250,000 barrels a day to reach this amount—something that looks very unlikely to happen. There seems to be no production plateau, and it appears that production may be declining by as much as 25% per year.
Natural gas production capacity for Thunder Horse is 200 million cubic feet per day. Production for natural gas doesn’t look any better.
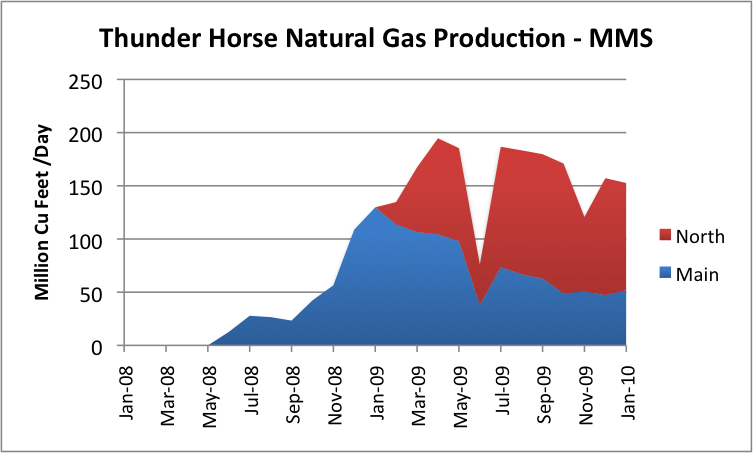
While it was designed to hit 200 billion cubic feet of gas per day, it never really hit that level, and also seems to be declining at around 25% per year.
Background
There are two parts to the Thunder Horse complex as shown on the map below. Each block is 3 miles on a side. An anticline/turtle structure located on MC 778 and MC 822.Then there is Thunder Horse North which lies along the salt wall to the north of Thunder Horse proper.

The main field consists of four producing wells, TA-001, TA-003, TA-004, and TD-001. There is also a fifth field, TA-002, which has not been put on line yet.
There is also production from blocks to the north of the main field, called Thunder Horse North on blocks MC 775, 776 and 777. There are five wells on these blocks, which are producing from sands uplifted against the Thunder Horse salt. These are TC-001, TC-002 (both on MC776) and TB-001, TB-002, and TF-001 (all on MC777).
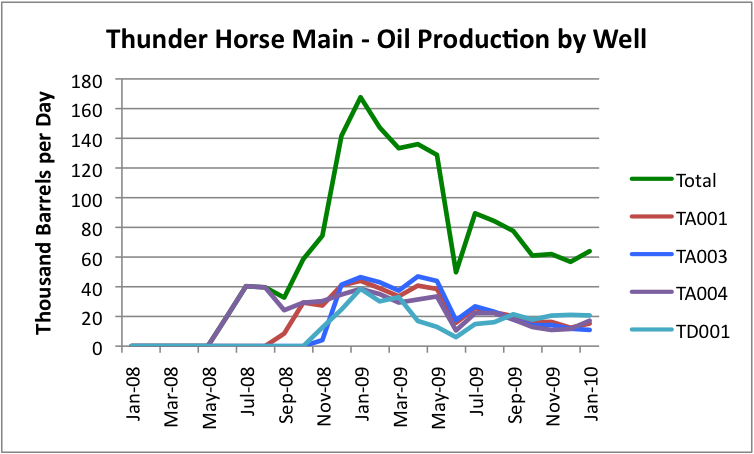
Production on all of the wells in the Main Field has been lower since June 2009.
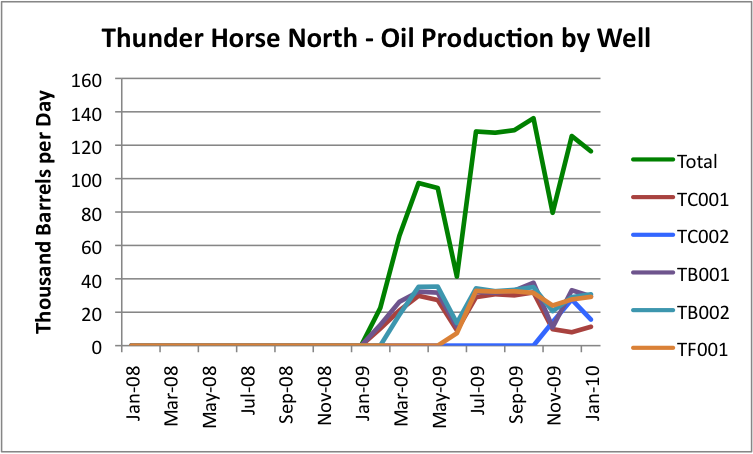
Production from Thunder Horse North started much more recently. So far, except for TC001, production from these wells seems to be holding up, but the length of drilling experience is at most a year.
One of the issues seems to be that BP is now finding that the fluids extracted in the main field include an increasing proportion of water.
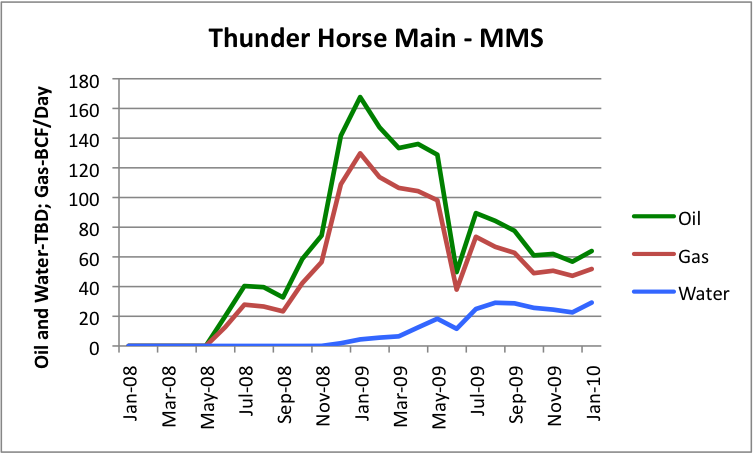
As Figure 6 shows, Thunder Horse main field has rapidly rising water. Thunder Horse North field doesn’t have rapidly rising water; indeed it has no water at all. Probably because of this, the wells at the main field have been choked back and the North has been allowed to produce all out.
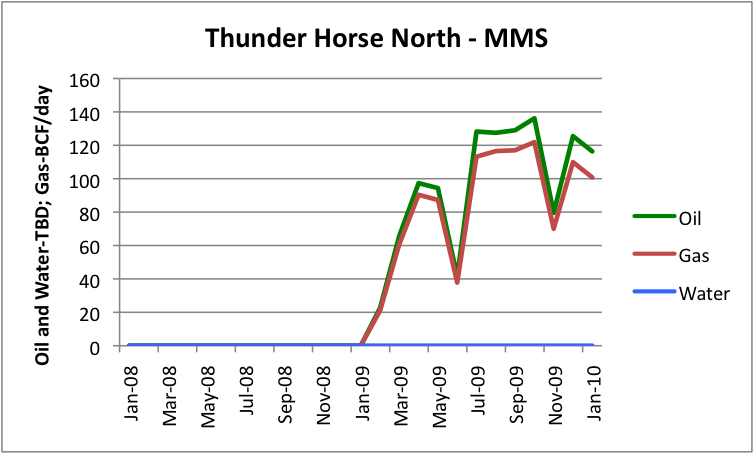
Figure 7 shows Thunder Horse North is behaving quite well—no water cuts so far.
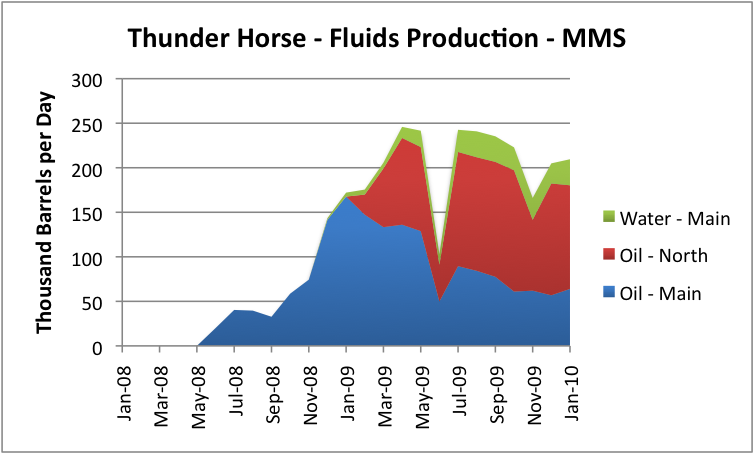
Thunder Horse was built with a total of 390,000 barrels a day of fluid capacity—250,000 barrels of oil, and 140,000 barrels a day of water.
Neither the daily production of water nor gas have reached the limits of the facility handling capacity, so with that in mind, one can view the drop in total fluids as most likely due to the natural pressure decline reducing the flow. Thunder Horse has no injection wells (they initially thought they needed it but then changed their minds). The field is producing just above 200,000 bbl/day of fluids and that is a concern.
It is a concern because the facility was designed to produce 390,000 bbl/day of total liquids. They are not bringing that much to the surface. The fact that the total liquids is slowly declining says one of two things: either the pressure decline is not allowing those flow rates, or they are throttling back on the flow to avoid coning the water into the wells and thus further harming the reservoir. But either way, the field is not performing as it was probably expected.
Implications
What are the implications for the ultimate hydrocarbon recovery for this field? If one could maintain 250,000 bbl/day of oil production until a billion barrels were recovered (something that can’t possibly be done), it would take about 11 years to recover the billion barrels. I only make this comparison to point out one thing–the whole complex is not producing 250,000 bbl/day of oil, as shown in Figure 1.
The decline is 2-3% per month and even adding one well per month from October 2009 to January 2009, the decline has continued resulting in the complex producing only around 180,000 bbl/day. The well added in January was MC775, which is not on the main field but against the salt on the northwest side of the basin. If adding new wells isn’t stopping the decline, then the underlying decline is quite steep.
When BP drilled the first well and announced a billion barrels, they were announcing that for the main field. Were it not for the North field, it would be clear that this field is not going to produce the advertised barrels. I will not mention numbers that engineers, with whom I have spoken, have suggested as the total volumes that will be produced by the entire complex. Who knows how the North field will produce? But I will say that unless something significant happens to change the situation, the ultimate production from the Thunder Horse complex will fall significantly short of a billion barrels.
Can the North field make up for the deficit in the main field? In my opinion it won’t. Almost every well along the salt flank appears to be in a separate fault block and some of the down dip wells drilled along the north salt wall have encountered water-saturated sands. That means that water is coming to the North wells, sometime in the future. Given that the North was the later development and has been producing a shorter time, the delay in the water is partly understandable. That being said, the North field has produced longer without water than did the main field. Let us hope that the wells to the north fill in the deficit that is showing up in Thunder Horse proper.