
The most surprising feature of the current oil crisis is that it does not really feel like a crisis. Oil and gas prices may be high and many people are struggling to cope with rising energy bills, but at a macro level, the world’s largest economies have grown consistently in the past two years. Hardly is our fear realized—that high energy costs will force an economic downturn, much less a recession. What explains this disconnect between expectation and reality?
To examine this question, take three mechanisms through which oil prices affect economic performance (there are more, but let’s focus on three): a reduction in income caused by the need to spend more money on energy leads to reduced demand for goods and services and this, in turn, forces an economic slowdown; an increase in inflation generated by higher prices that firms charge to cover energy costs leads to a reduction in real income; and worsening performance by firms, reflecting mainly higher costs and/or reduced overall demand by shrinking real income.
Begin with the first mechanism: US households spend more money on energy today—that much is obvious. But as Figure 1 shows, the amount spent on energy as a percentage of personal consumption is not very high, certainly not as high as it was in the late 1970s or early 1980s, when over 9% of personal consumption went to fuel oil, coal, electricity and gas. In 2005, energy expenditures as a share of consumption were 5.8%, up a full percentage point since 2003, but still below peak levels. Granted the data is not unambiguous—for example, current consumption is linked to high debt levels—but there is a clear sign that today’s high energy prices are not putting a strain on the economy that is comparable to that felt in the late 1970s.

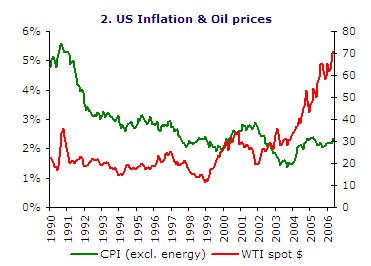
What about inflation? Over the past fifteen years (1990-2005), there has been an observable decline in inflation, driven by a variety of factors unrelated to oil. As Figure 2 illustrates, the link between higher oil prices and inflation is all but clear (here is shown the Consumer Price Index excluding energy prices to gauge the effect of energy prices on other goods): in 1999-2001 there seem to be a rise in oil prices that is followed by an increase in inflation; after 2002, however, oil prices go higher, as inflation goes down; and by 2003, oil prices skyrocket, with only a minimal effect on inflation. Here, again, there are various exogenous factors to consider—mainly better macroeconomic management and the influx of goods from China, which have kept prices low. But this does not negate the underlying fact—that higher oil prices have not generated inflation, at least not to the level expected (and feared) by observers.
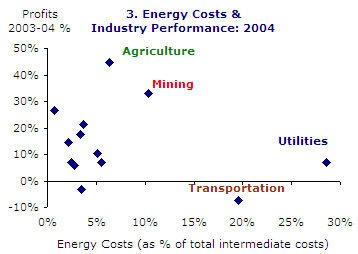
This reality produces the following question: could it be that firms are taking the hit? It is possible that firms would try to absorb energy costs in order to maintain demand for their goods. If this were true, we would expect firms that need a lot of energy to suffer more than firms that need less energy for their outputs. There is some evidence for this hypothesis, though the verdict is ultimately mixed: as Figure 3 shows, utilities and transportation—two energy intensive industries, had mixed results in 2004 with the former turning a profit while the latter suffering losses. From the rest (excluding Agriculture and Mining), there appears some trend, albeit weak, linking higher energy intensity and lower profits. At the same time, the numbers involved (energy costs at around 5-10% of total intermediate costs, and generally high profits) for most industries suggest that we cannot rely on this explanation—that firms are taking the hit—for understanding why oil prices are not having a large effect on the economy.
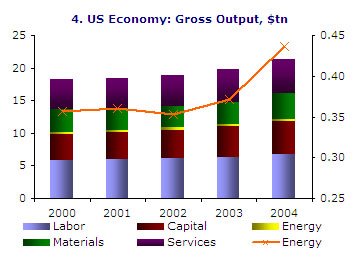
Perhaps the clearest view on this question comes from a more basic statistic: how much do firms spend on energy? Figure 4 shows gross output in the United States for the years 2000-2004 (gross output is labor and capital expenses, which make up GDP, as well as firm expenditures on energy, materials and services). The left axis plots gross output while the right axis shows total energy costs. What is impressive is that energy costs make up such a small portion of total costs (or total output). Even with high prices in 2004, energy costs make up about $450bn or 4.5% of total input costs. More than anything else, this should underscore why large changes in energy expenditures are not placing as high a strain on the economy, even though the fact that prices have risen more orderly than in the past may help explain why the adjustment has been less painful.
Granted, economic performance is but one aspect of the current energy crisis; it may not even be the most important. Granted too, that these numbers rest on a macro-level analysis and may conceal many problems, not least that of that families trying to pay their energy bills. Granted also that there are many international dimensions (even imbalances) to consider that may be salvaging economies from recession. But there is still some truth in here—that economies can grow in spite of high energy prices should make us rethink energy security and the calamities we tend to associate with rising oil costs. It may also give us some reassurance about our ability to make the transition from hydrocarbons to other energy sources as painless as possible. And that is good news for the long term.
References:
Figure 1 data come from the Economic Report of the President (February 2006); Figure 2 data come from FRED—the Federal Reserve Economic Data; Figure 3 and 4 data come from the US Department of Commerce, Bureau of Economic Analysis, while the WTI spot prices for figure 3 are from the Energy Information Administration. All numbers / years are latest available.