NOTE: Images in this archived article have been removed.
In this post I will, amongst other things, present the results from my review of the Bakken portion of Leonardo Maugeri’s discussion paper “The Shale Oil Boom: A U.S. Phenomenon”
Leonardo Maugeri is an ex-ENI executive now with the Harvard Kennedy School Belfer Center which receives funds from BP. His discussion paper presents his findings from “tracking” 4,000 tight oil wells in USA.
Maugeri forecasts total U.S. tight oil production to reach 5 Mb/d by end 2017 of which 1.8 Mb/d from Bakken.
In this review I have examined Maugeri’s well productivity claims, cash flow developments and transport/infrastructure issues (which has been ignored by Maugeri).
During my studies of tight oil wells in Bakken I have looked at the history of about 5,000 wells in Montana and North Dakota.
Considering the number of wells studied that formed the basis for Maugeri’s paper and over time the huge individual variations in well productivities, decline rates etc., it would have been good if the paper had also presented more of the statistical analysis performed that would support its findings.
Statistics is an excellent and powerful tool for analyzing such extensive research.
From Maugeri’s paper p. 31
“My analysis of the productive pattern of more than 1,400 producing oil wells in Bakken-Three Forks suggests that productivity per well has increased dramatically over time.”
Maugeri does not describe any future decline in average well productivity. My analysis
Will the Bakken “Red Queen” have to run faster? of actual well data from NDIC documents a significant decline in average well productivity from 2010 which during H2 2011 stabilized at a total of 85 kb for the first 12 months of flow.

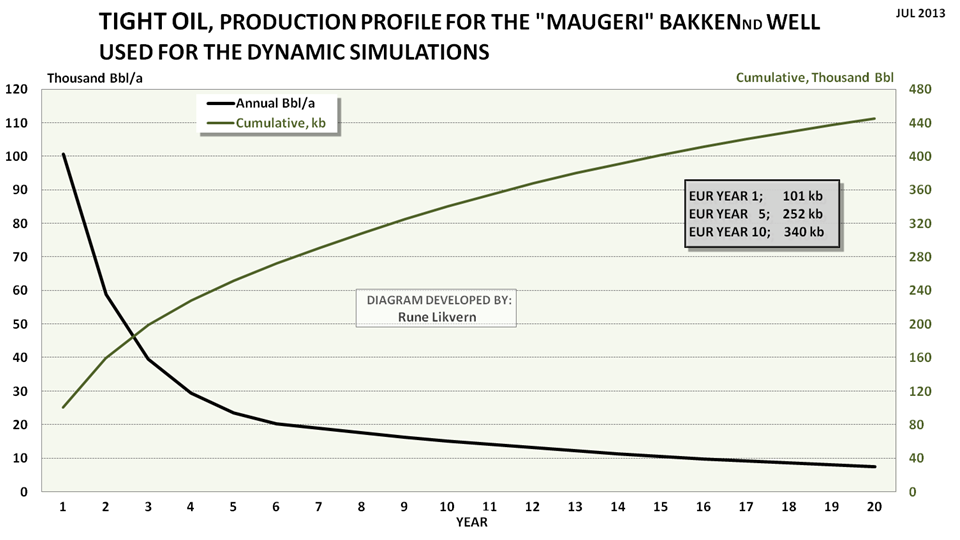
Figure 2: Maugeri’s typical well for 2012 used for the model, (see also figure 3 on page 10 in his paper).
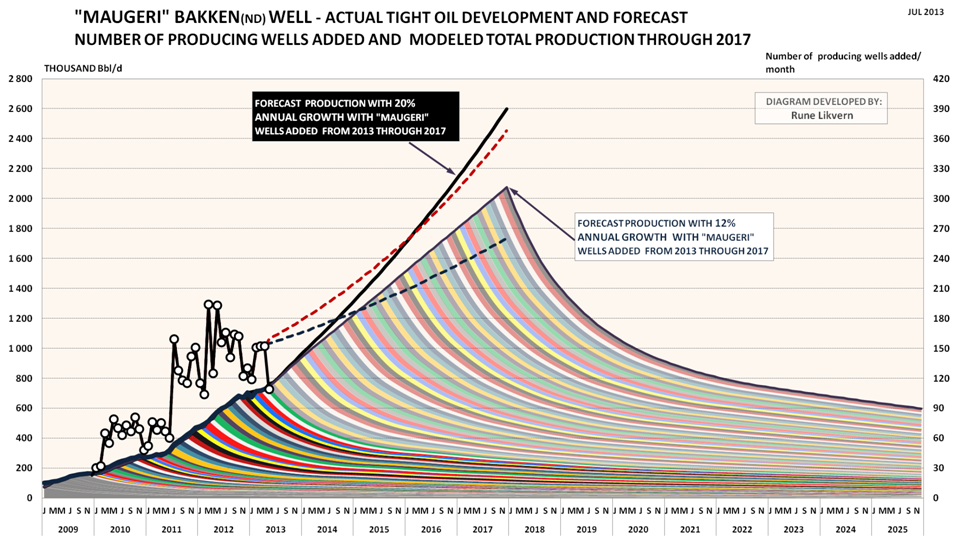
FORECAST PRODUCTION THROUGH 2017 WITH MAUGERI’s ASSUMPTIONS
Maugeri’s scenarios assume 12 – 20% average annual growth in well additions from 2013 through 2017. As I found no mention by Maugeri about possible future changes in well productivity, the model used the 2012 well detailed by Maugeri (see also figure 2) throughout 2017.
Maugeri’s assumptions would lead to:
12% annual growth, blue dotted line, results in 260 wells/m in December 2017.
20% annual growth, red dotted line, results in 370 wells/m in December 2017.
Recent monthly well additions in Bakken ND have on average been around 150 and in recent weeks NDIC has reported a decline in active rigs in Bakken while the oil price has strengthened.
Estimated total number of net added flowing wells June 2013 – December 2017 using Maugeri’s assumptions:
- 11,200 with 12% growth
- 13,800 with 20% growth
As of May 2013 NDIC reported a total of 5,730 flowing wells for Bakken/Three Forks.
Maugeri’s 12% and 20% growth scenarios resulted in estimated/modeled total oil production of respectively 2.1 Mb/dand above 2.6 Mb/d by Dec 2017.
Maugeri forecast 1.8 Mb/d by 2017, page 32 in his paper.
Given the oil price scenario I used for this study, I assumed that if the number of Bakken’s new producing wells increases progressively by 12–20 percent a year from 2013 on, the play may reach a crude oil production of 1.8 mbd by 2017.
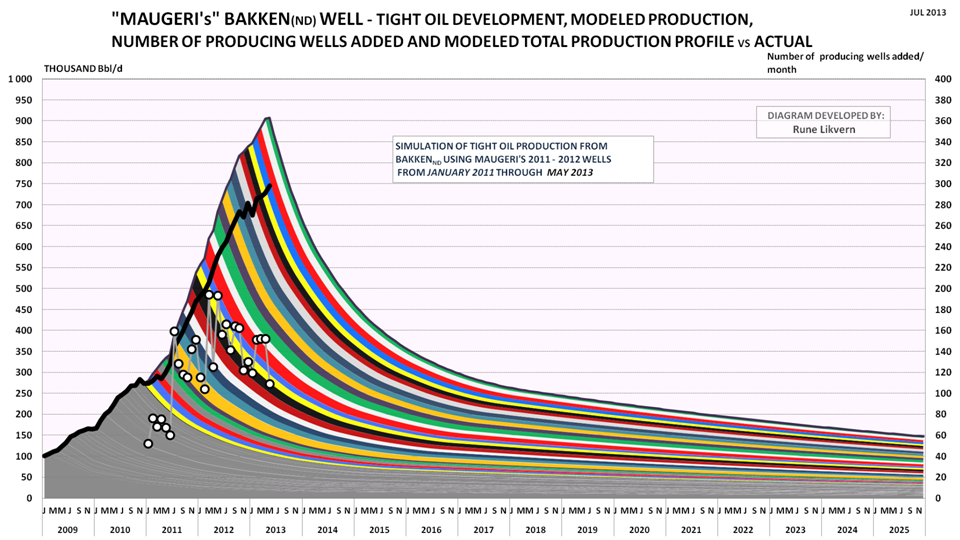
Figure 3: The colored bands show development in total production (Maugeri’s 2012 well multiplied by net number of wells added during the month) added by month and its projected development (lh scale) at 12% growth in well additions through 2017.
The white circles show actual net added producing wells by month (rh scale). The thick black line reported production from Bakken (North Dakota) by NDIC (lh scale).
The 20% growth scenario in well additions is shown by the dark blue line (lh scale).
The chart also shows forecast developments for monthly well additions with respectively 12% growth (black dotted line) and 20% growth (red dotted line) through 2017 (rh scale).
The model was calibrated to start simulations as from June 2013.
NOTE: The chart shows modeled development in total production as of end 2017 and a forecast for production from the total population of wells at end 2017 towards 2025. The chart does not imply anything about well additions beyond 2017.
Maugeri’s assumptions will result in close to a doubling of rigs drilling in Bakken (ND) by 2017 and if this is viewed in the context that it is highly likely that shale gas drilling in North America will have picked up by then from expected growth in natural gas prices, this suggests increased pressure in the delivery chain for goods and services required to manufacture wells, and thus cost inflation.
Maugeri also uses an assumption of an average annual 8% decline in well costs towards 2017 which does not give the impact from future shale gas activities any considerations. Further there were not any references to credible sources that could support Maugeri’s assumption for future declines in well costs.
12% and 20% annual growth in well additions were estimated to produce totals of respectively 5.1 Gb and 6.0 Gb of oil from June 2013 through December 2025 without any well additions post 2017.
As of May 2013 around 0.7 Gb of had been produced from Bakken.
ESTIMATES ON NET CASH FLOW AND CUMULATIVES
- There is no mention in the paper about needs for additional funding and oil companies’ remaining debt capacities.
- Expectations for sustained higher oil prices also encouraged the oil companies to take on more debt to supply the market with (costlier) oil from more expensive sources.
12% and 20% annual growth in well additions starting from June 2013 were estimated to require respectively $5 billion and $9 billion in additional external funding, of which a major portion is likely to be debt additions, through 2015 and 2016 before any reduction of total debts could take place.
If Maugeri has some built in assumption of declines in future well productivities (which there is no mentioning of) in his production forecast this would result in increased needs for external fundings.
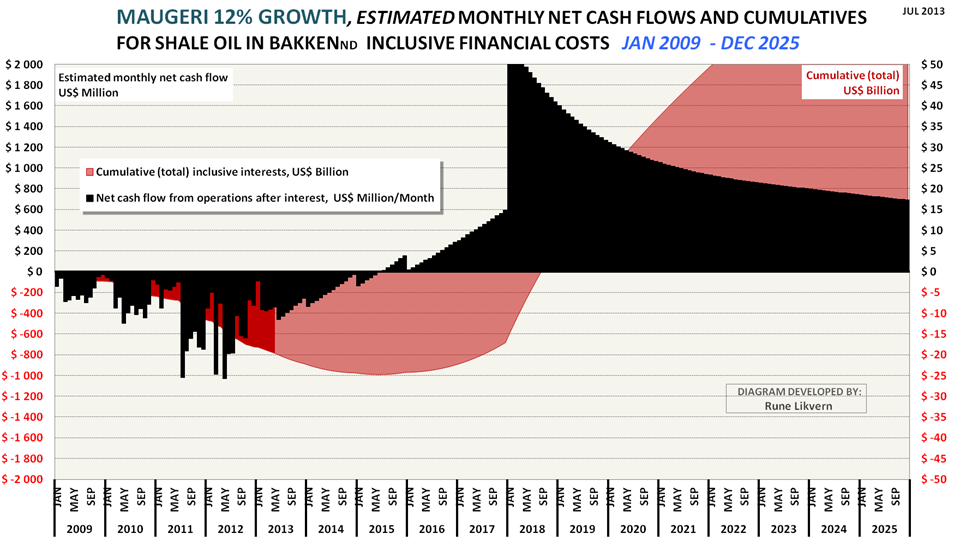
Figure 4: The chart above shows an estimate of cumulative net cash flows post CAPEX for tight oil from Bakken (ND) as from January 2009 and as of May 2013 (red area and rh scale) and estimated net cash flows post CAPEX for the same months (black columns and lh scale). The chart also includes the estimates from the model runs with Maugeri’s assumptions for oil price developments, well productivity (Maugeri’s 2012 well), annual decline in well costs of 8% from 2013 through 2017 and annual growth in well additions of 12% from 2013 through 2017.
Further the chart shows an estimate on monthly net cash flows through 2025 based upon Maugeri’s assumptions per his paper and 12% annual growth in monthly well additions.
Assumptions for the chart as of May 2013 are WTI oil price (realized price), average well cost starting at $8 Million in January 2009 and growing to $10 Million as from January 2011. All costs assumed incurred as the wells were reported starting to flow (this creates some backlog for cumulative costs as costs in reality are incurred continuously as the wells are manufactured) and the estimates do not include costs for completed non- flowing and dry wells.
Estimates do not include any effects from hedging, dividend payouts, retained earnings and income from natural gas/NGPL sales (which now and on average grosses around $3/Bbl).
Estimates do not include costs for acreage acquisitions and investments in processing/transport facilities and other externalities like road upkeep etc.
INFRASTRUCTURE/TRANSPORT
Above some level of flow the most cost effective way to transport oil and gas beyond a certain distance is by pipeline. Oil production in North Dakota and Montana is landlocked and distant from its main consumers, the refineries.
One of the things that caught my interest as I went through several presentations with forecasts for growth in oil (and natural gas) from Bakken was that I found few maturing plans to move more oil by pipeline.
Why?
As pipelines would offer the most cost efficient solution for bringing oil to the markets, all involved in Bakken tight oil extraction would stand to profit (exception being the rail companies). With lowered costs for transport comes a higher net backed price at the wellhead. This has thus the potential to increase the oil companies’ profits, result in higher tax and royalty payments and provide the pipeline companies acceptable returns.
Long distance big diameter pipelines take years to complete from planning, sanctioning, financing, right of ways, construction etc. before they become fully operational.
To understand possible reasons why more oil pipelines from Bakken might not happen at a scale reflecting many pundits’ forecasts for production growth and levels; it may help to look at what it takes to make a pipeline commercial.
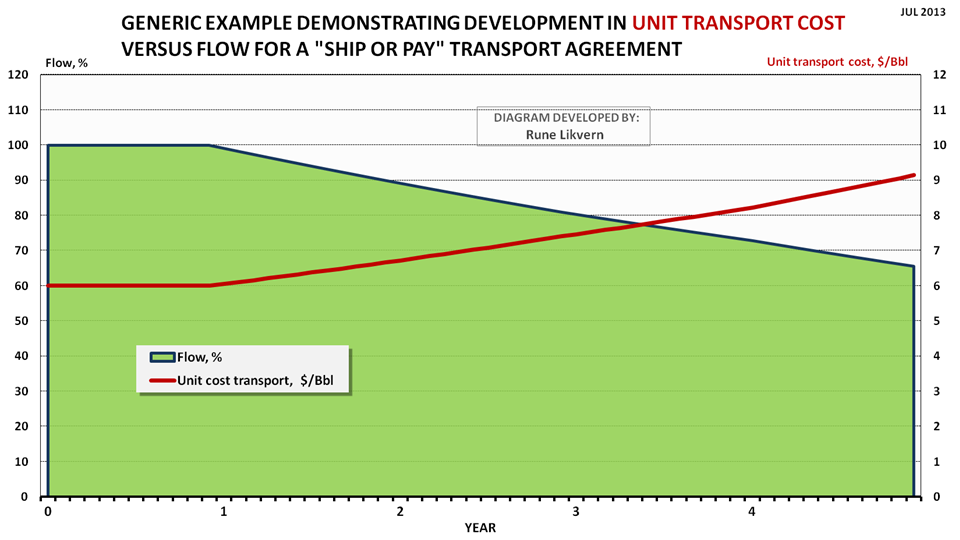
Figure 5: The chart above illustrates the dynamics for unit transport costs derived from a ship or pay contract as shipped volumes decline.
The oil companies are highly aware of the steep decline rates from the tight oil wells, oil price swings, productivity changes etc. which also makes it hard for them as shippers to commit to long term firm nominations/bookings of capacities (transport profile) for tight oil production that could provide the commercial basis for increased transport of oil by pipeline from Bakken.
Tight oil developments offer great flexibilities for CAPEX adjustments with price developments, and periods with lowered prices are likely to reduce CAPEX and thus bring with it the prospect of rapid declines in total production. Committing to long term capacity nominations/bookings thus exposes the oil companies (shippers) to the risk of rapidly growing unit transport costs during periods with lowered needs for transport. This risk appears to be outweighed by the apparent higher costs incurred from transport by rail (or truck), which allows for more capacity flexibilities according to needs.
The pipeline companies need predictability and they therefore strive to build a portfolio of long term ship or pay capacity nominations/bookings (commitments) to ensure a predetermined minimum return from their investments and operations.
TULSA, Okla., Nov. 27, 2012 /PRNewswire/ — ONEOK Partners, L.P. (NYSE: OKS) today announced that it did not receive sufficient long-term transportation commitments during its recently concluded open season for the Bakken Crude Express Pipeline. As a result, the partnership has elected not to proceed with plans to construct the pipeline.
"Despite the robust outlook for crude-oil supply growth in the Williston Basin in the Bakken Shale, we did not receive sufficient long-term commitments under the terms we needed to construct the Bakken Crude Express Pipeline," said Terry K. Spencer, ONEOK Partners president.
Maugeri’s forecast growth to 1.8 Mb/d from Bakken by 2017 would provide for long term capacity utilization for pipelines with total capacities of at least 0.6 – 0.8 Mb/d, (see also figure 3 above).
A viable indicator of oil companies’ expectations for long term production levels from Bakken would be sanctioned plans for construction and total transport capacities of oil and gas from Bakken to the market.
- Maugeri does not mention anything about the potential for realizing additional major oil (and gas; a big portion of the associated natural gas has been and will continue to be flared) pipelines based upon his forecast for growth in oil production from Bakken.
- Could the present lack of long term ship or pay commitments from the oil companies that could form a commercial basis for considerable additions to pipeline capacities for oil from Bakken be the proverbial “canary” that reflects the oil companies’ true expectations about their growth for oil production from Bakken/Three Forks?
FUTURE OIL PRICE DEVELOPMENTS
At one point I agree with Maugeri. That is about his expectation for a future decline in the oil price.
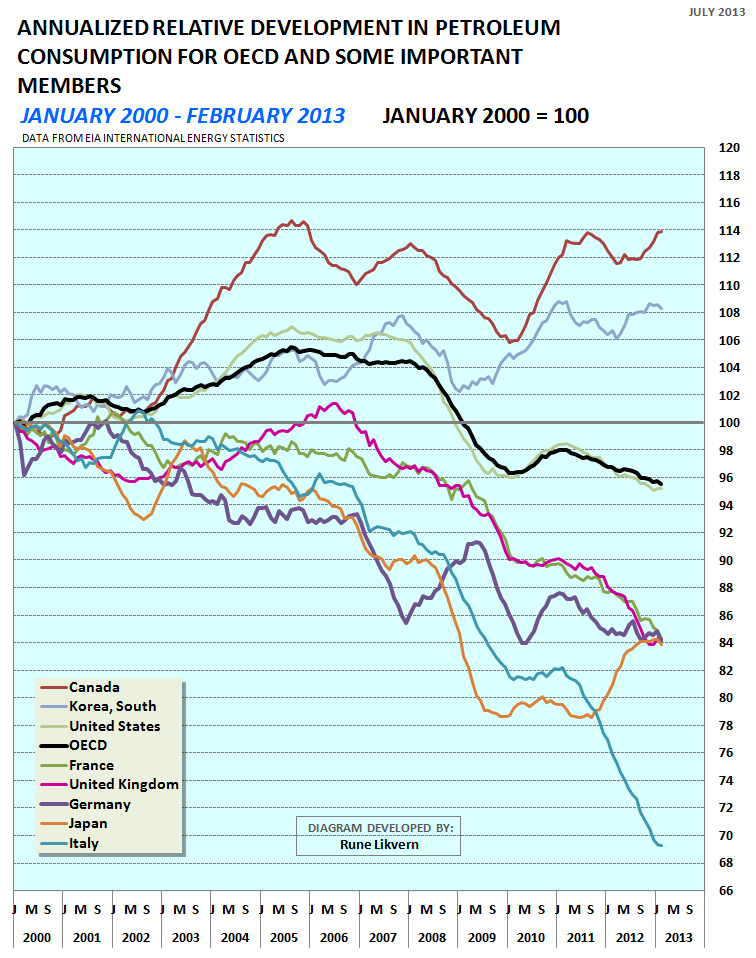
However, my expectations are well founded for somewhat different reasons, such as persistent lowered global real economic growth, and continued weakening of consumers’ ability to afford expensive energy, which so far and according to EIA data, has led to significant declines in consumption of “expensive” energy within OECD, primarily USA, Italy, Spain, Portugal and Greece to name a few, (see also figure 6). Any growth in global oil supplies will therefore likely intensify any downward pressures on the oil price.
Figure 6: Chart above shows annualized relative developments in total petroleum consumption for OECD and its 8 biggest members with January 2000 as baseline.
The chart above clearly demonstrates that the recent general higher oil prices together with troublesome total debt levels have led to significant declines in consumption/demand within OECD. It is worth noting that one of the economies with one of the world’s highest trade surpluses and “moderate” total debt levels, Germany, has seen a decline in its petroleum consumption of around 16% in the last 12 years. It is not clear if this decline is all due to efficiency gains.
During the last 10 years Italy has seen a decline of more than 30% in its total petroleum consumption.
One of the prerequisites that enables a country to continue growing imports of more expensive energy is a trade surplus or trade balance at least.
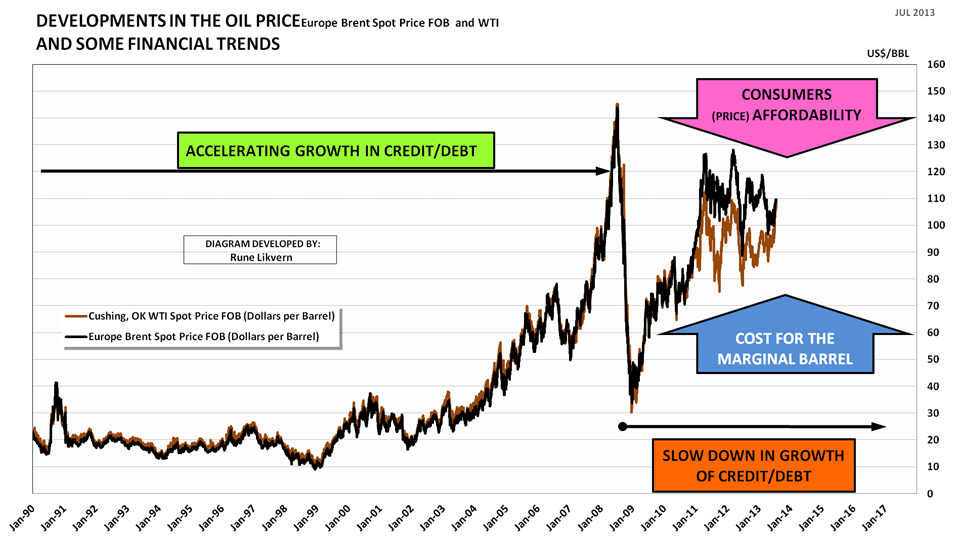
Figure 7: The chart above shows the developments in the benchmark Brent and WTI crude oil prices as from January 1990. In the chart is also shown some mega financial trends and the present direction of the main forces acting to balance the oil price.
In the last three decades (at times) accelerating growth in public and private debt also allowed for growth in global oil consumption and for some time tolerances for much higher oil prices. Growth in aggregate debt can go on until it cannot. As the combined effects from debt deleveraging (debts are being paid down or written down, which is the definition of deflation) and austerity as it sets in in earnest will continue to affect aggregate demand also for petroleum/oil as shown in figure 6.
So far, the emerging economies, primarily represented by China, have grown their petroleum consumption and thus ensured a modest 2.5% global growth in crude oil and condensates consumption since 2005.
Even China with its present huge trade surpluses and foreign reserves will have limited financial capacity to sustain and absorb the compounding effects from growing petroleum (energy in general) imports and high oil prices.
A growing number of countries will increasingly have to prioritize their use of any trade surpluses amongst providing for more expensive food and any growth in consumption of expensive energy for their growing populations.