NOTE: Images in this archived article have been removed.
Introduction
The modelling methodology is the same as in my previous analyses, which started 20 years ago, namely the use of a multi-cycle logistic curve (and its derivatives) to extrapolate the future. The ultimate reserves are those extrapolated from the creaming curve. In a creaming curve, the cumulative backdated 2P reserves (proved plus probable, with the mean value assumed) is plotted versus the cumulative number of discovered fields (or of the new field wildcats). The reserves in the creaming curve incorporate all past revisions and reserve hikes, attributed to the year of original discovery. Very few countries report production and reserves by field: the UK (DECC), Norway (NPD) and the US for the Federal offshore. Therefore, one has to rely on expensive scouting and scout databases, which are not available to the general public. But even then, the scout databases need to be corrected to estimate the actual “2P” reserves.
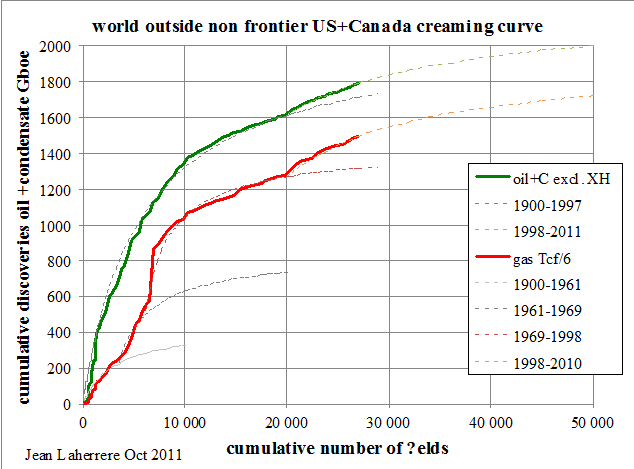
 Figure 1: World outside non frontier US & Canada creaming curve for crude less extra-heavy oil
Based on the creaming curve in Figure 1, the ultimate reserves for the world outside the conventional onshore of the US and Canada are about 2000 Gb for crude less extra-heavy (XH) oil, and 1700 Gboe for natural gas. This plot of backdated reserves versus the cumulative number of fields cannot be extended to the onshore US and Canada because there are too many fields with unavailable data and different definitions. However, if one adds the backdated 2P discoveries for the conventional US onshore (thanks to US-DOE data) and for Canada (thanks to CAPP backdated data) to the previous data, the cumulative world discovery versus time converges to an oil ultimate of 2200 Gb and a gas ultimate of 2000 Gboe. This last figure equals 12 Pcf, but this round estimate from 2012 is now estimated in 2013 at 13 Pcf (see Figure 15).
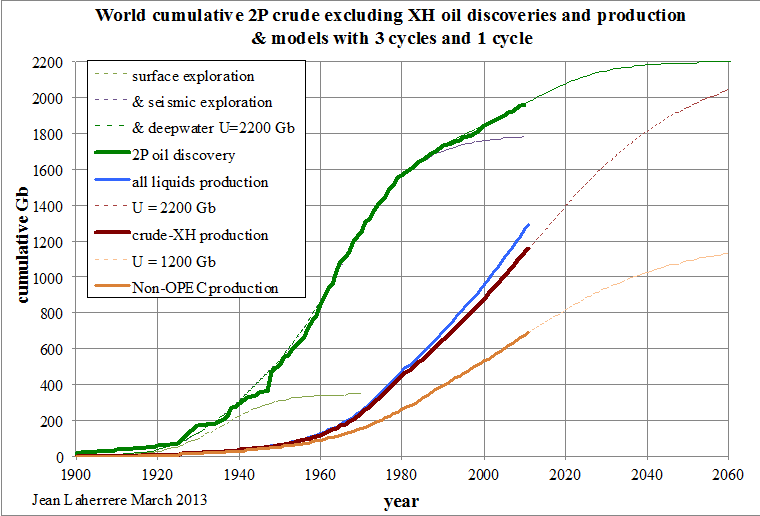
Figure 2: world cumulative oil (crude less extra-heavy) & gas discovery & production
The three cycles, which can be observed in Figure 2, are well-known in exploration:
- the first one is the surface exploration based on seeps and on surface anticlines, from 1900 to 1945;
- the second one is based on seismic surveys showing buried anticlines, from 1945 to 1990;
- the last one is the exploration of deep-water and sub-salt reservoirs, from 1990 to 2011.
Oil production, in particular from OPEC countries, is badly reported because their fight on quotas prevents them to clearly disclose reserves and production data. Sadly, monthly OPEC oil reports rely on secondary sources, often quite different from data directly communicated by OPEC members.
The US-DOE/EIA reports total oil supply as the sum of crude, condensate and natural gas plants liquids (NGPL). The plots of these data start flattening in 2005, followed by a bumpy plateau. The post-2010 increase is mainly caused by the increase of liquids from US shale gas and US shale oil.
Figure 3: world crude oil (crude, NGL + liquids) production 1980-2012 after the EIA
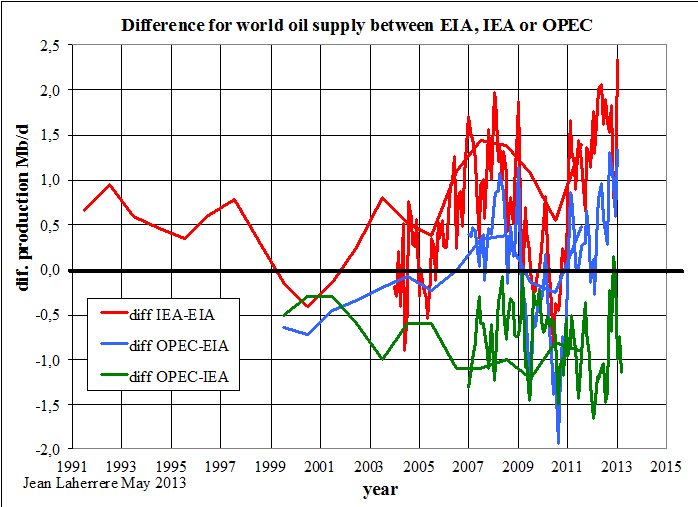
It is frightening to see the large discrepancy between the values of the so called “oil supply” from different sources and also its evolution with time.
Figure 4: annual & monthly difference from world oil supply between EIA, IEA & OPEC
One can note that big changes occur at the beginning of the year when definition changes take place.
Remaining world oil reserves
The data on proved reserves publicly available are either political (issued by OPEC without audit) or financial – all majors listed in the US stock market must follow the Securities and Exchange Commission (SEC) rules with an audit. The confidential technical data on 2P (mean values) is only available from expensive and very large scout databases.
Figure 5: world remaining oil reserves from political/financial and technical sources
There is a huge difference between the political/financial proved reserves in brown, which has always increased since 1947, and the confidential technical 2P reserves in green, which has been decreasing since 1980. This graph explains why most economists do not believe in peak oil. They rely only on the proved reserves coming from OGJ, EIA, BP and OPEC data, which are wrong; they have no access to the confidential technical data. Economists ignoring peak oil do not think wrong, they thing on wrong data!
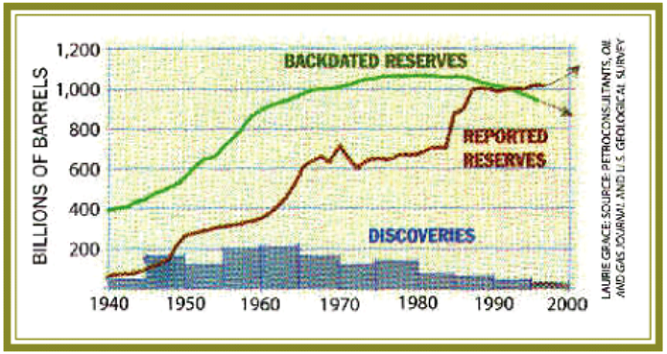
The graph below, from the article “The end of cheap oil” by Campbell & Laherrere published in March of 1998 in Scientific American is confirmed today. At the time, we expected the green curve to go down and the brown curve to go up, but we did not expect the latter to move so high (plus 600 Gb) after a long plateau!
Figure 6: world remaining oil reserves from political/financial and technical sources in Scientific American March 1998 “The end of cheap oil” Campbell & Laherrere
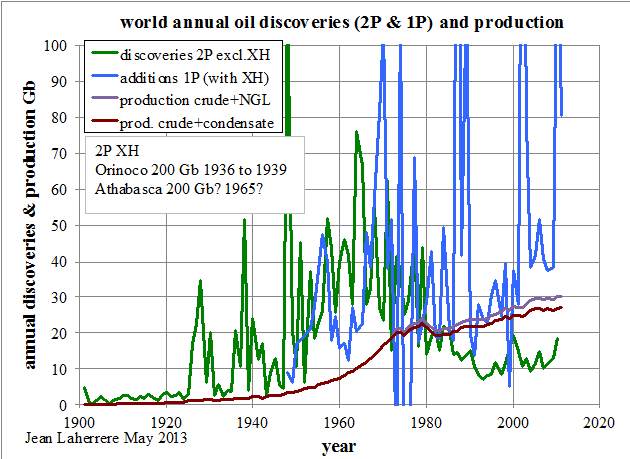
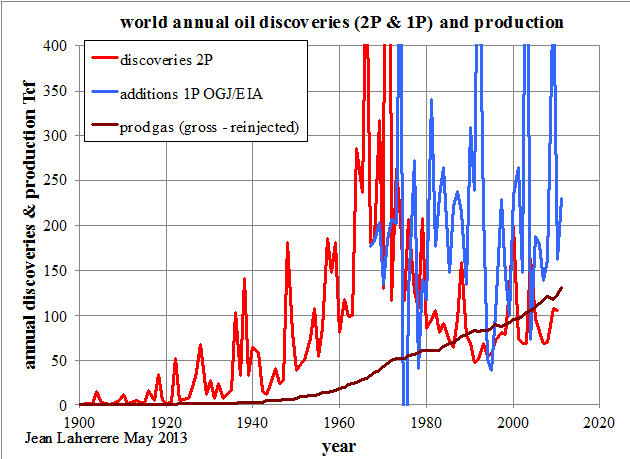
The following graph displays the same data as Figure 5, but now as annual discoveries for 2P and 1P, compared to annual production (crude oil + condensate and crude + NGPL). Annual production has exceeded 2P annual discoveries since 1980, but not 1P annual additions.
Figure 7: world annual oil discoveries (2P & 1P) and production
The same graph for natural gas annual discoveries and production shows that 2P discoveries are larger than production up to 2000.
Figure 8: world annual natural gas discoveries (2P & 1P) and production
Economists rely on the 1P additions by the EIA to believe, even before the shale boom, that there is no problem, because additions to proved oil and gas reserves are twice the production. In reality annual 2P oil discoveries are about half the production!
Estimates for ultimate oil and gas reserves
One can only plot the cumulative (backdated mean) discovery over time, which suggests that the world ultimate for crude less extra-heavy oil is at 2200 Gb.
Figure 9: world crude less XH oil cumulative discoveries and cumulative production modeled with an ultimate of 2200 Gb
Crude oil + NGL
Annual production of conventional crude, extra-heavy oil and NGPL is plotted for the world, OPEC and non-OPEC.
Figure 10: world, NOPEC & OPEC crude less XH, XH & NGPL annual production
OPEC crude less extra-heavy oil production will overpass non-OPEC around 2030.
For unconventional oil, despite the sharp increase in the US (mainly light tight oil, the new name for shale oil), the rest of the world may face many above ground constraints. So, world ultimate unconventional oil reserves may be lower and be well within the accuracy range of total world crude oil. Thus it may not change much the long term production, but I could be wrong.
All liquids
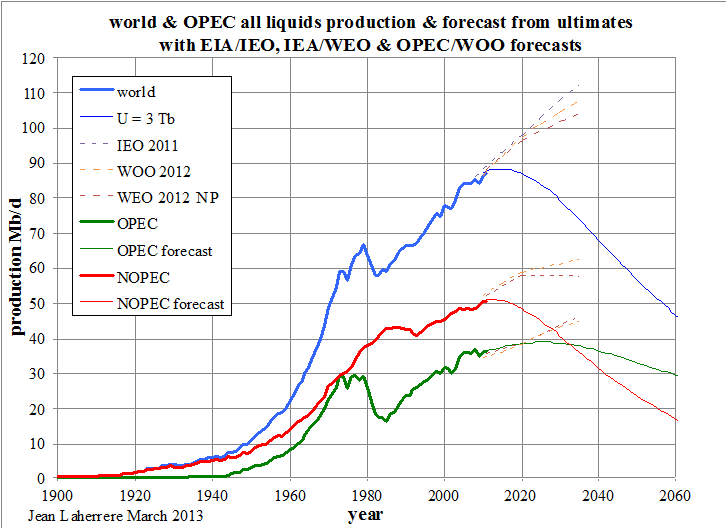
The breakdown of all liquids production is given for OPEC and Non-OPEC.
Figure 11: OPEC & Non-OPEC all liquids production & forecast 1900-2060
All liquids from OPEC will overpass Non-OPEC around 2030 in my interpretation, when the 2012 WEO NP puts it around 2050. The last IEA forecasts report an increase in oil production from 2012 to 2018 of 8% for Non-OPEC (+30% for the US) and of 7% for OPEC, which is doubtful in my opinion.
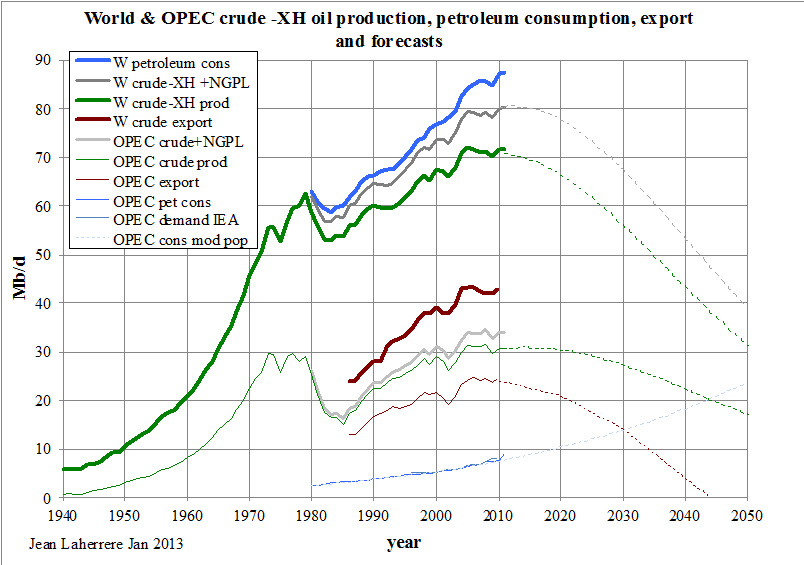
World and OPEC crude less extra-heavy oil production, petroleum consumption and exports are plotted and extrapolated until 2050. OPEC consumption (thin blue) is extrapolated using the UN population forecast: it will cross OPEC crude oil production (thin green) around 2045. Exports from OPEC (thin brown) are plateauing and will decline to zero before 2050, unless their heavily subsidised consumption is reduced like it was in industrialised countries.
Figure 12: world & OPEC production, consumption & export 1940-2050
When oil exports cease, somewhere before 2050, OPEC will no longer act as a producer cartel.
The US exception
The US is an exception in the world because oil in the ground belongs to the landowner, while in the rest of the world it belongs to the State. It is why there are over 20 000 oil companies and thousands of oil service companies in the US and only one in Saudi Arabia. The US production excluding Alaska displays a symmetrical curve with a peak in 1970, as forecast by King Hubbert in 1956.
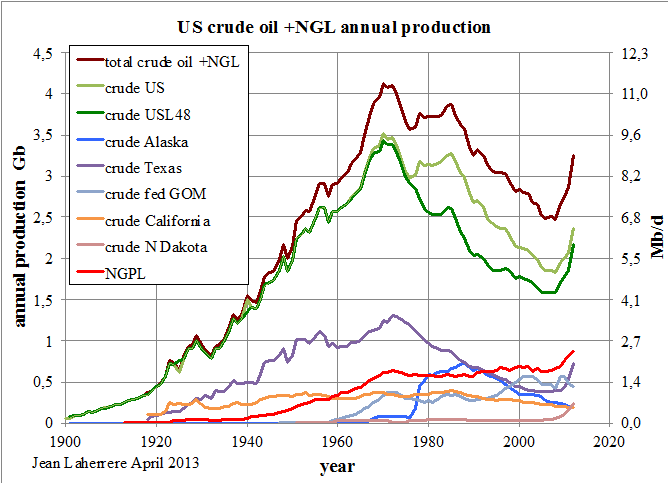
Figure 13: US crude oil & NGL production 1900-2011
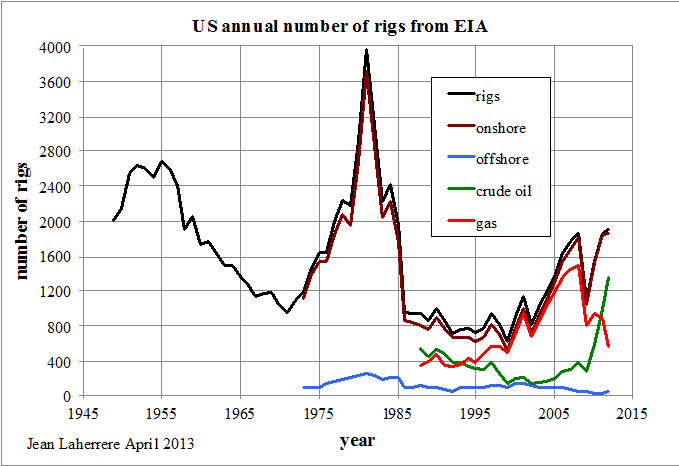
The number of rigs in the US peaked in 1980 when the second oil shock coincided with the end of price controls, triggering a drilling frenzy. Even the worst prospects were drilled, resulting in many dry wells and a sharp decline at the 1986 oil counter shock, staying low until the late 1990s.
Figure 14: US annual number of rigs 1947-2012
Drilling activity in the US is cyclical, peaking in 1955, 1980 and probably now. The "drill baby drill" practice is due to the shale oil boom, itself caused by the high oil price and the easy money flows provided by the eased monetary policy. Today US explorers are complaining about the lack of conventional prospects and, moreover, of unconventional gas prospects, since the number of sweet spots in shales seem decreasing.
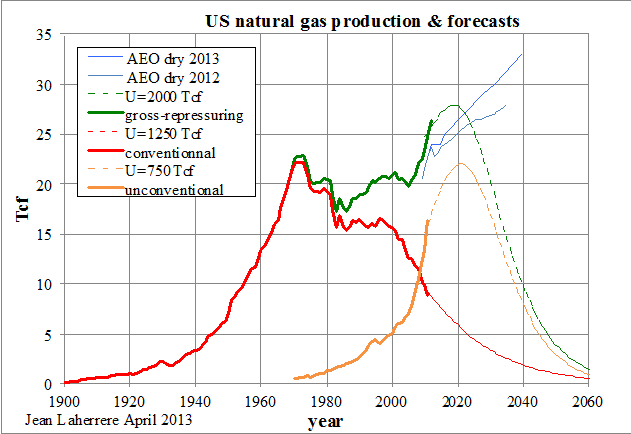
Natural gas production in the US, which peaked in 1970 like oil, is showing a sharp increase since 2005 because of shale gas. In 2011 unconventional gas production (CBM, tight gas and shale gas, in orange in Figure 15) was higher than conventional gas production (in red). The ultimate for conventional natural gas seems to be 1250 Tcf and the unconventional ultimate was estimated at 750 Tcf, summing to a round total of 2000 Tcf. The USDOE reports shale gas ultimate reserves at 482 Tcf and only 273 Tcf for proved reserves.
This 2000 Tcf (2 Pcf) leads to a peak in 2020 at 22 Tcf and the decline thereafter of all natural gas in the US (in green) should be quite sharp. The goal of exporting US liquefied natural gas seems to be based on very optimistic views, as those shown in the 2013 AEO, where US production is forecast to be 33 Tcf in 2040, against 10 Tcf in my forecast!
The gross monthly natural gas production in the US has been flat since October of 2011, after its sharp increase since 2003, with only shale gas production rising.
Figure 15: US natural gas production 1900-2060
Some claim that the US can export its shale gas as LNG even though conventional gas (in red) is declining fast and will be quite small in just a few years.
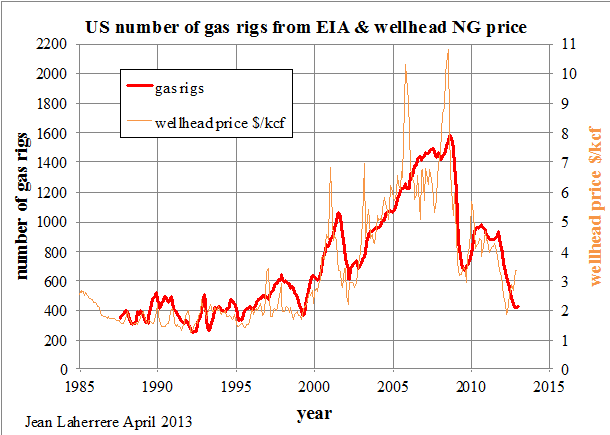
There is an amazing fit between the monthly number of rigs in the US and the monthly well head natural gas price from 1987 to 2013 (the period of available monthly data).
Figure 16: US natural gas price and number of gas rigs from EIA
The ratio between oil and natural gas prices in the US has varied widely since 1950. Starting at 7 (meaning that oil was 7 times more expensive per unit of energy at the well head than natural gas) down to 1 between 2000 and 2005 (the normal), up again to a peak at more than 9 in May of 2012 and down again to 4.5 in December of 2012. The ratio varies roughly as the percentage of US gas flared (versus marketed production), and since 1995 as the percentage of gas flared in North Dakota. The lack of gas pipelines creates a glut with low prices and flared gas. This situation with cheap natural gas is unsustainable and has led to lower coal prices and to the expectation of LNG exports.
Figure 17: US oil over natural gas price and flared over marketed gas percentage
World, Non-OPEC & OPEC natural gas production forecasts
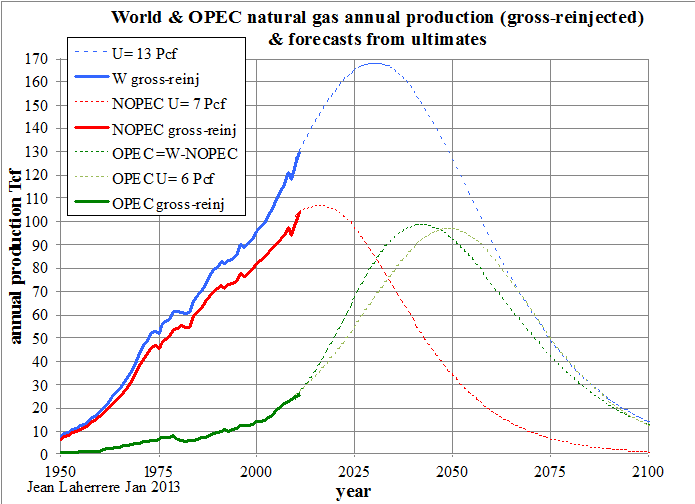
Annual natural gas production is modelled on the basis of ultimate reserves: 13 Pcf for the World, 7 Pcf for Non-OPEC (NOPEC) and 6 Pcf for OPEC.
Figure 18: world, NOPEC & OPEC natural gas annual production
With the estimate of 7 Pcf for Non-OPEC ultimate reserves, production will peak around 2020 at more than 100 Tcf/y. Unless new reserves become available, only an intensive drilling program could delay this peak, but at the expense of a sharper decline. Gas production from OPEC will peak around 2050 also at about 100 Tcf/y.
Outside the US, the potential of shale gas is very uncertain because the "Not In My Back Yard" effect is much stronger when the gas belongs to the country and not to the landowners. Unless the mining legislation is changed, the potential of shale gas is weak, with the largest unknown being China. Suffice to say that up to now, there is no example of economical shale gas production outside the US. The hype on shale gas will probably fall like the hype on bio-fuels a few years ago.
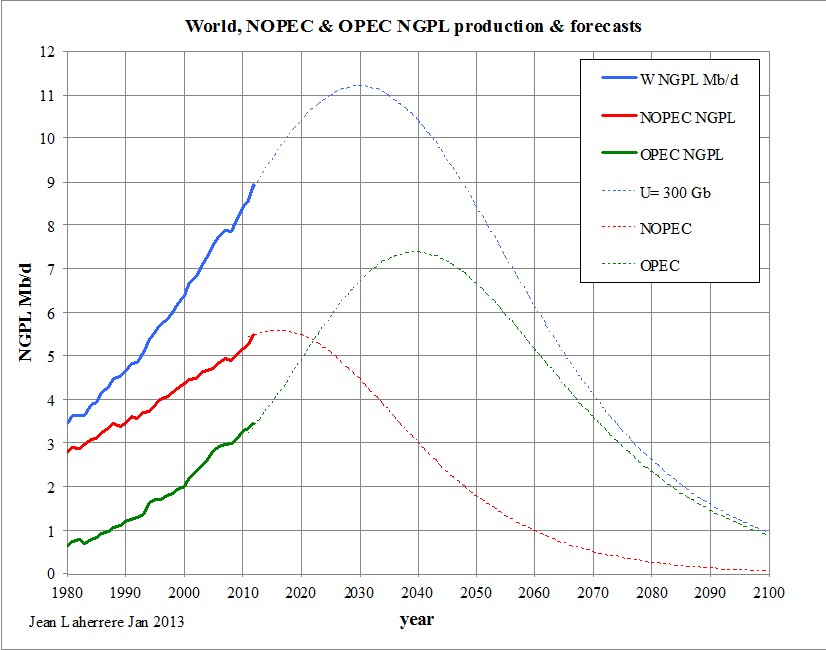
Natural Gas Plant Liquids (NGPL)
These liquids summed up to 9 Mb/d in 2012, but with a 36% lower heat content than crude oil. In 2012, the heat content of oil was 5.8 MBtu/b and 3.7 MBtu/b for US NGPL (versus 3,9 MBtu/b in 1980).
Figure 19: world, NOPEC & OPEC NGPL production & forecasts for 300 Gb ultimate
World NGPL production (in blue) may peak in 2030 at over 11 Mb/d, whereas Non-OPEC (in red) will peak before 2020 at 5.5 Mb/d; OPEC (in green) should peak around 2040 at 7.5 Mb/d.
Oil forecasts from different ASPO authors
For a long time Colin Campbell has published (also in an Atlas) oil and gas forecasts up to 2030, more recently updated up to 2050. His forecasts for oil plus NGPL is compared to mine and to Pierre-René Bauquis (PRB), along with past liquids production data. The discrepancy between the different sources for the 2010 data is 3 Mb/d (Figure 4), about the same between these three authors, despite all three being among the founders of ASPO. For 2020 this discrepancy rises to 10 Mb/d and for 2040 it becomes quite large, with production ranging from 50 Mb/d to 100 Mb/d!
The uncertainty is high on past oil production and much higher on future oil production.
Figure 20: world oil production & forecasts from different ASPO authors
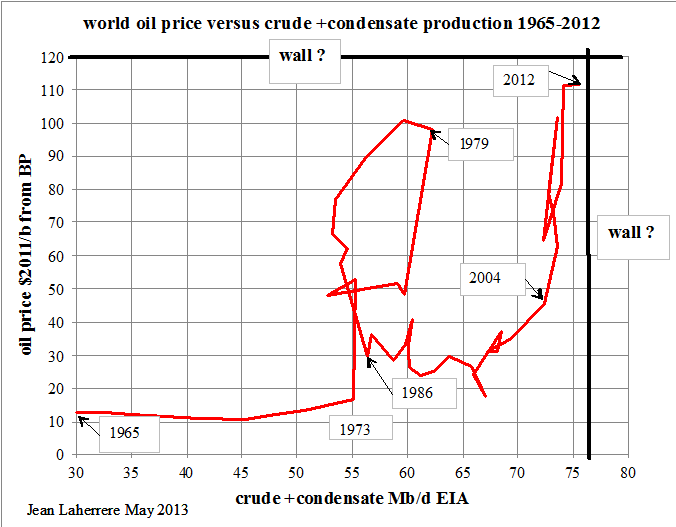
Walls on oil price and on crude oil production
The plot of oil prices in 2011 dollars versus crude oil plus condensate based on BP data seems to have two "walls": one at 120 $/b for the price and another one at 76 Mb/d for production. However, official inflation figures and BP data are questionable. So, where should these two "walls" be exactly put? In fact extra-heavy oil should be excluded.
Figure 21: world oil price ($2011/b) versus crude oil production 1965-2012
Peak Oil Deniers
Peak oil deniers claim that peak oil is an unscientific theory, ignoring that peak oil has actually happened in several countries like France, UK, Norway… and that there are more producing countries on decline than on the rise! Peak oil deniers claim that our estimate on world ultimate does not take into account the economy, in particular the oil price. They confuse proved reserves, which are supposed to represent the expected production with present technology and economy (with the oil price at end-year) with the 2P mean reserves, which are used to compute the Net Present Value from a forecast on oil price for the life of the production. The best proof of the quality of my estimate on remaining 2P reserves in Figure 5 in 2013 with an oil price of 100 $/b is that the values are nearly the same as in Figure 6, produced in 1998 when the oil price was at 10 $/b.
For unconventional oil (where tertiary recovery methods are used, such as steam or fracking) the problem is not the size of the “tank” but the size of the “tap”, with oil prices limiting production rates. In Figure 10 this is reflected with the peak of extra-heavy oil put around 2070.
Shale oil is now called light tight oil because the production in Bakken is not from a shale reservoir, but a sandy dolomite reservoir between two shale formations. It has huge resources when estimated simply by the amount of hydrocarbons generated by the source-rocks within the oil kitchen. In the 1994 report “Undiscovered petroleum potential” (Laherrere, Perrodon, Demaison) the efficiency factor (percentage of ultimate reserves versus hydro-carbons generated from source-rocks in the kitchen) was estimated as being very low:
- 1.4 % in the Arab-Iranian Petroleum System (most of the Middle East);
- 1% in the North Sea
- 0.8 % in the Saharan Triassic
- 0.6% in the Niger Delta
- 0.4 % in Gippsland
- 0.3 % in Kutei & Putamayo
- 0.03 % in the Paris Basin.
Most of the oil generated is either lost, diffused in the sediments or still within the source-rocks among the fractures. Huge volumes of hydro-carbons still exist in source-rocks, but the recovery factor should be quite low: a few % at best!
In Montana, production from Bakken is mainly coming from the stratigraphic field called Elm Coulee, which is decline since 2008. In North Dakota, production from Bakken has sharply increased from 50 kb/d in 2008 to 715 kb/d in March of 2013, but it may be close to peak by lack of further sweat spots to drill. Another reason to expect a peak in North Dakota still this year is the decline of rigs in activity, from a peak of 200 in June of 2012 to 176 in April of 2013.
Increase in fuel prices: price of oil or one litre of diesel in France compared to the minimum wage
For many Frenchmen, diesel fuel (what 80% of French cars consume) is today very expensive. But they forget that in 1960 25 minutes of work at the SMIC (minimum wage) rate were necessary to buy one litre of diesel, when only 9 minutes were needed in 2012 (but 6 minutes in 1991).
Figure 22: number of hours or minutes to buy one barrel of oil or one litre of diesel fuel with SMIC wage
The display for the number of hours needed to buy one barrel of oil with the SMIC wage is quite different because of French taxes. In 1960 6 hours were needed, in 1980 11 hours and in 2012 over 9 hours.
Conclusions
Oil and gas production data are unreliable and the UN should oblige every country to publish true, updated and complete data on energy. This is especially important for fossils fuels, which are a gift to humanity, alas, sadly soon to be reduced because of energy supply constraints. In the US SEC rules should be changed in order to report mean (2P) reserves instead of proved reserves.
The present study is based on ultimate reserves, mostly estimated from the extrapolation of discovery data coming from scout databases. Only three countries report reliable field data: UK, Norway and the Federal US. If most other countries were to follow their example, such study would be much more reliable. It is a shame that the need of reliable data is not understood in New York at the United Nations or in Brussels at the European Commission.
With the poor data available today, it seems that world oil (all liquids) production will peak before 2020, Non-OPEC quite soon and OPEC around 2020. OPEC will cease to export crude oil before 2050. Present subsidies to gasoline prices in Venezuela and Iran (one hundred times less expensive than in Turkey) are unsustainable and lead to high consumption in detriment of exports. OPEC production of NGPL will overpass Non-OPEC production around 2025. For crude less extra-heavy oils OPEC should overtake the rest of the world around 2030; about that time the same should happen with natural gas. The dream of the US becoming independent seems to be based on resources, but not on reserves.
Of course the present study is based on questionable assumptions and unreliable data, but anyone can look at the graphs and make his own interpretation or challenge the data. Again, alas, I do not know any free study showing as much as this paper.
Acknowledgements
Thanks to Jean-Marie Bourdaire for his comments and for correcting my Broken English.
There is a longer version of this paper, written in February, and a shortened version writen in May, both can be found at aspofrance.org.