
[Editor’s comment: This article is by Dr. Tad Patzek, chairman of the Department of Petroleum & Geosystems Engineering at The University of Texas at Austin. Dr. Patzek’s research involves mathematical modeling of earth systems with emphasis on multiphase fluid flow physics and rock mechanics. He is also working on smart, process-based control of very large waterfloods in unconventional, low-permeability formations, and on the mechanics of hydrate-bearing sediments. In a broader context, Patzek works on the thermodynamics and ecology of human survival and energy supply schemes for humanity. He has participated in the global debate on energy supply schemes by giving hundreds of press interviews and appearing on the BBC, PBS, CBS, CNBC, ABC, NPR, etc., and giving invited lectures around the world. This article first appeared on Tad’s blog Life Itself.]
Before I discuss the logic behind negating a peak of production of anything, let me sum up where we are in the U.S. in terms of crude oil production. According to the Energy Information Administration (EIA):
The United States consumed 18.8 million barrels per day (MMbd) of petroleum products during 2011, making us the world’s largest petroleum consumer. The United States was third in crude oil production at 5.7 MMbd. But crude oil alone does not constitute all U.S. petroleum supplies. Significant gains occur, because crude oil expands in the refining process, liquid fuel is captured in the processing of natural gas, and we have other sources of liquid fuel, including biofuels. These additional supplies totaled 4.6 MMbd in 2011.
Let me parse this quote.
First, let’s look at the history of oil production in the U.S., shown in the chart below. The vertical axis is scaled with a unit of power, exajoules (EJ) per year, very close to quadrillion BTUs (quads) per year. To convert from EJ/year to millions of barrels of crude oil per day (MMbopd), divide the vertical axis by roughly two, so 20 EJ/year is roughly equal to 10 MMbopd.
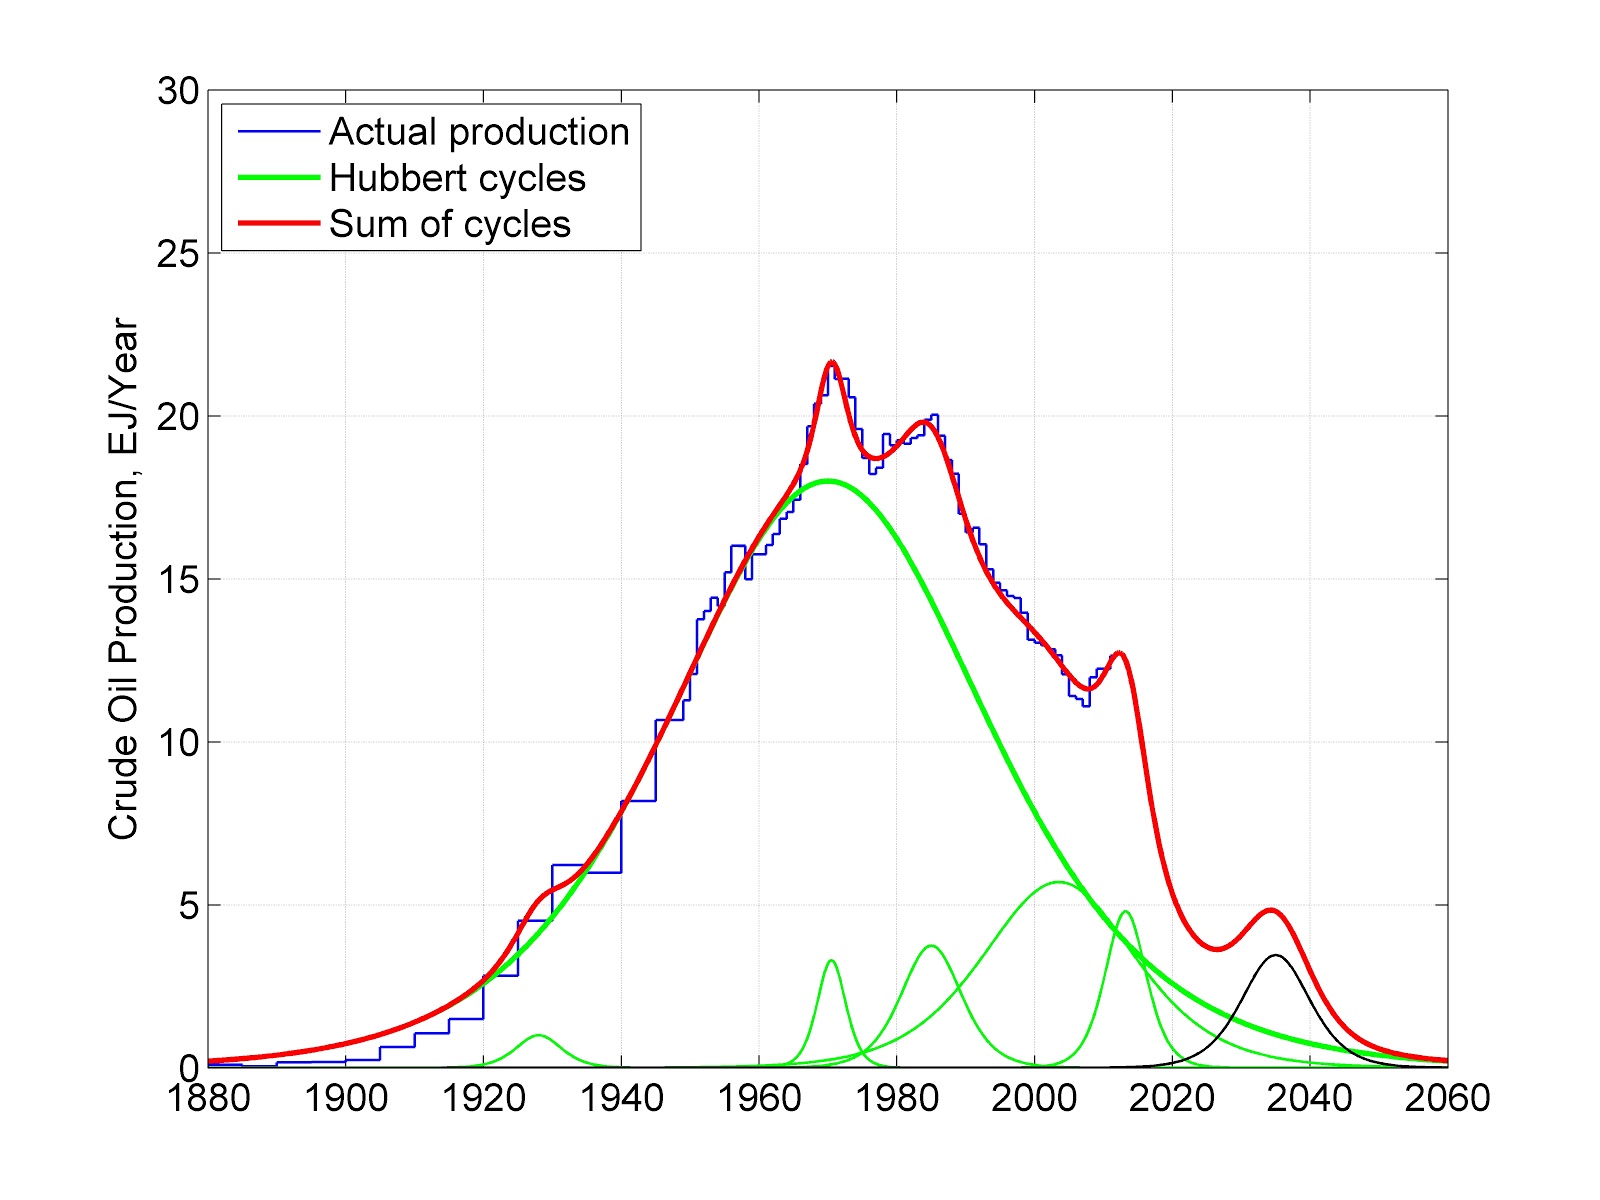
Historic production of crude oil in the U.S. is resolved into several Hubbert curves. The tallest one is the original Hubbert curve published in 1956. The smaller curves starting from 1960 were generated by producing shallow, deep and ultra-deep Gulf of Mexico, Alaska (mostly Prudhoe Bay), and then everything else that was not in the original curve: large waterflood projects, thermal and carbon dioxide enhanced oil recovery (EOR) projects, horizontal wells, hydrofractured wells, etc. The broad curve peaking in 2002 was introduced in late 2002, and the model represented fairly well the U.S. crude oil production until 2010. The last small green curve on the right was introduced last month to describe the Bakken and Eagle Ford shales, as well as the increased production of crude oil from the Permian Basin near Midland, TX. The right-most black curve depicts a hypothetical production of 7 billion barrels of oil from the Arctic Natural Wildlife Refuge (ANWR) in Alaska. So the last point on the blue step-line represents 5.7 MMbopd produced in the U.S. in 2011. This rate is predicted by EIA to grow to over 6 MMbopd in 2012.
Now, let’s look at the refinery gains in the second chart. These gains arise because petroleum products are usually less dense than the crudes they are made from. Therefore, refinery gains are not really a replacement of imported crude oil, and demonstrate only that since 1993, the U.S. refining has been moving towards heavier crude oil feedstocks.

Oil refinery gains reported by EIA since 1993 hover around 1 million barrels of all petroleum products per day. These gains arise because the densities of petroleum products (gasoline, kerosene, diesel fuel, jet fuel, heating oil, etc.) are less than the density of crude oil they were made from. It is like making a low calorie butter or cheese from a normal butter or cheese by puffing them up with bubbles of air. Through refinery gains, we have not created new energy. Instead, we have just puffed up the crude oil feedstock by cracking heavier hydrocarbons and hydrogenation. Thus, refinery gains do not really count as a new source of energy, but only as a source of an increased volume of petroleum products.
Corn ethanol comes next. I described the ethanol story completely in 2004, in my most popular paper ever. There was nothing new I would add in the intervening 8 years. Basically, ethanol is obtained from burning methane, coal, diesel fuel, gasoline, corn kernels, soil and environment. We destroy perhaps as many as 7 units of free energy in the environment and human economy to produce 1 unit of free energy as corn ethanol, and make a few clueless environmentalists happier and a few super rich corporations richer. The story is even worse for switchgrass ethanol. Finally, your mileage would drop by 33% if you were to use pure ethanol as a fuel for your car.
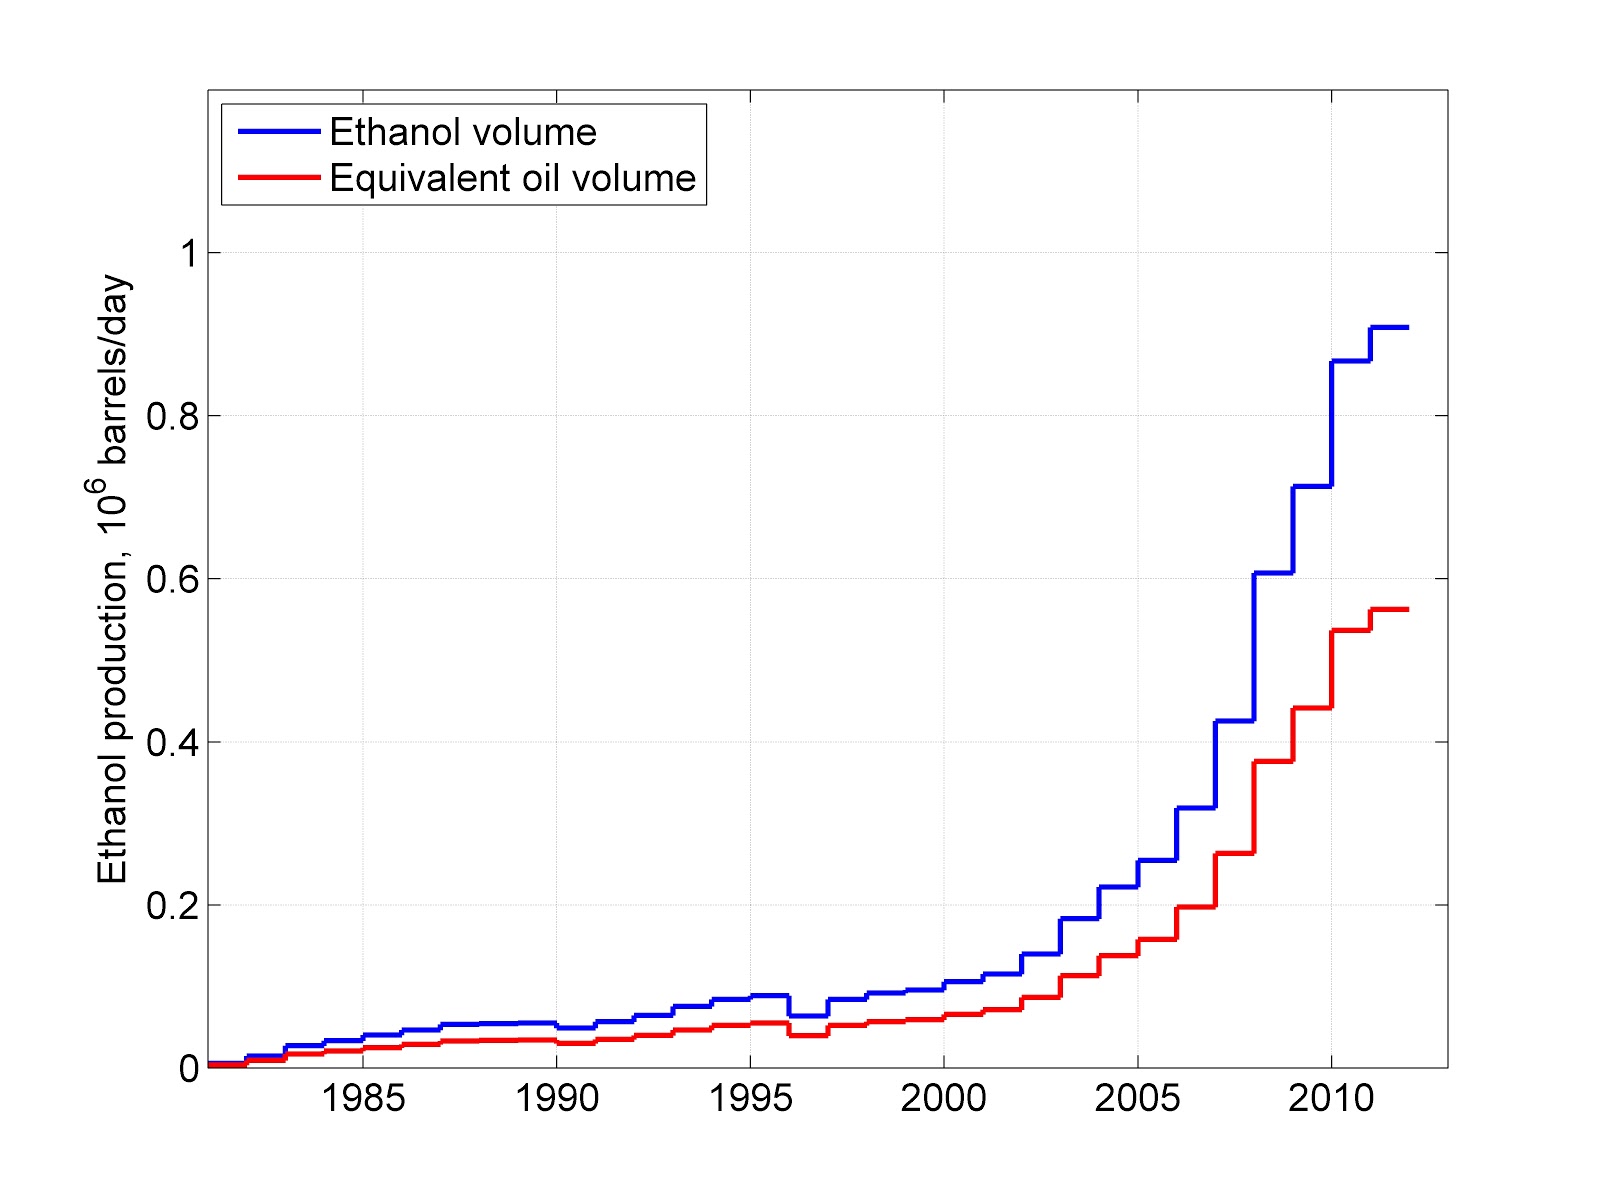
Production of corn ethanol in the U.S. Because ethanol has a lower heating value, its volume would be much lower when converted to equivalent crude oil.
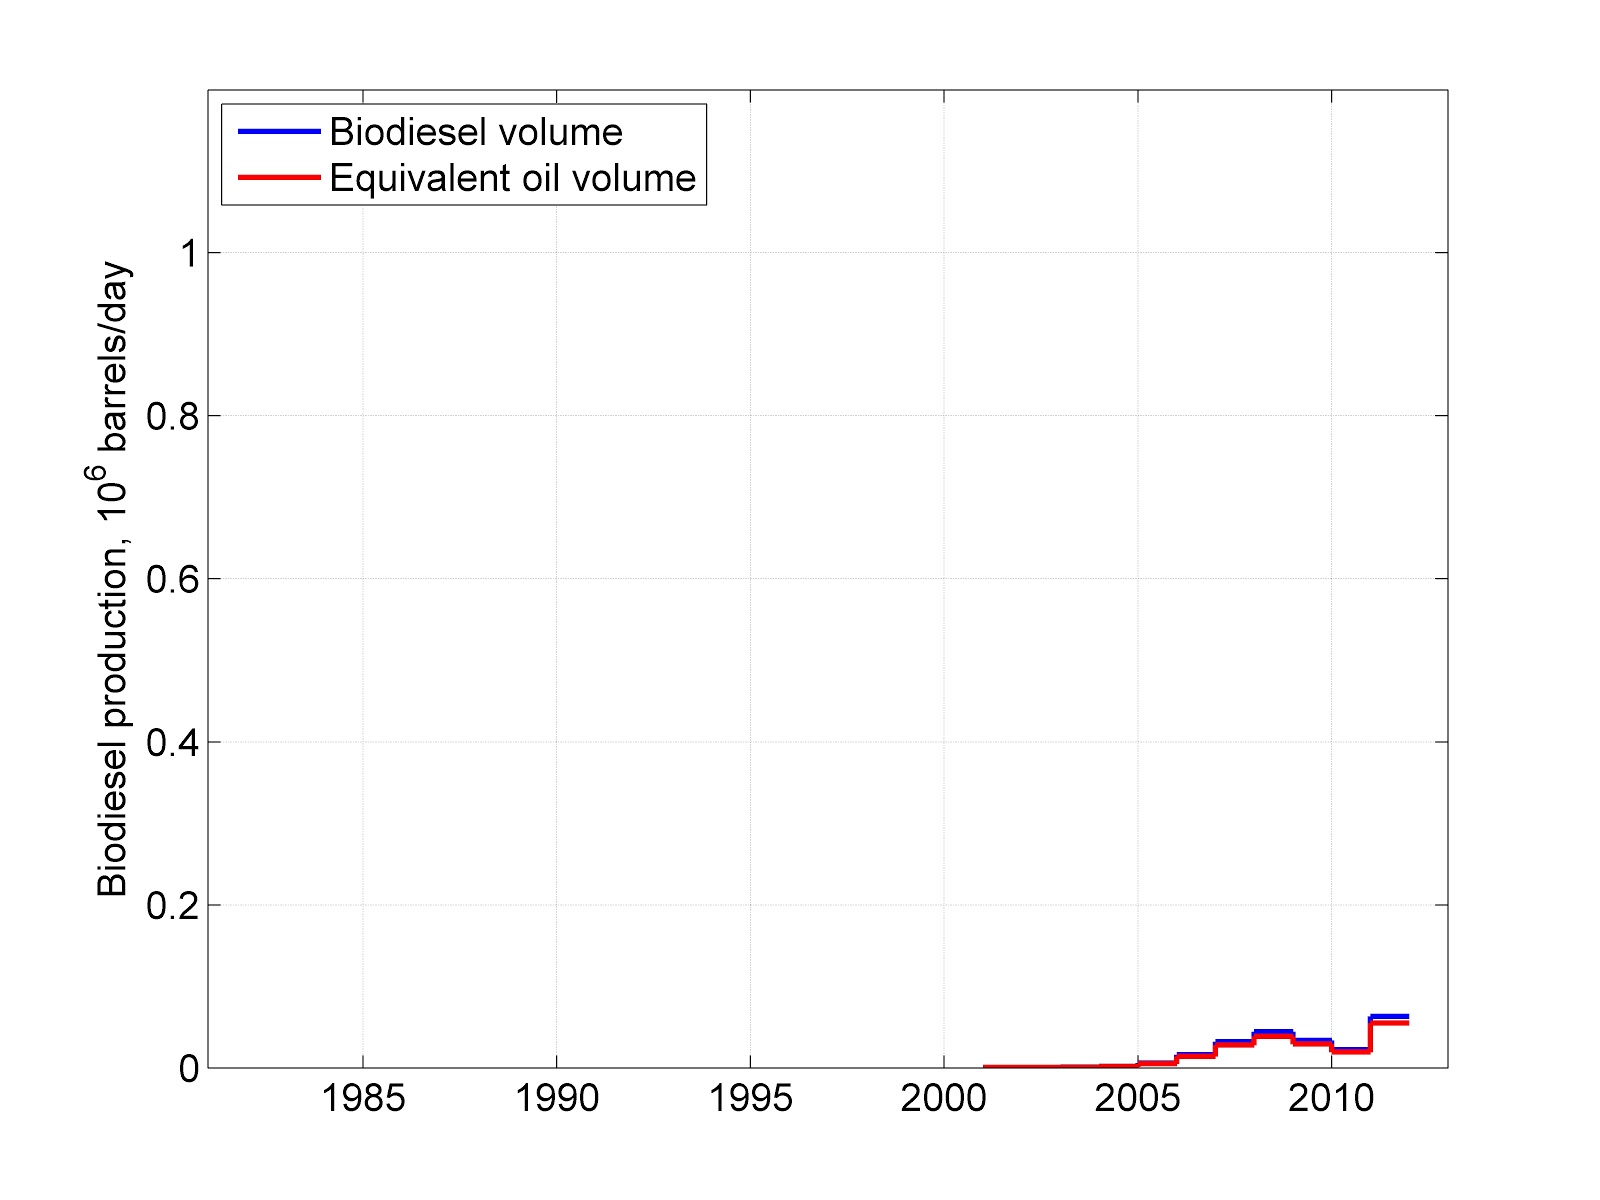
Production of soybean biodiesel in the U.S. is almost irrelevant, but also highly environmentally damaging. Since most of the obliteration of the irreplaceable biota occurs in the tropics, in Brazil, Argentina, Africa, and Asia Pacific, we really don’t care. Either way, the rate of biodiesel production in the U.S. is too low to write home about it.
In summary, of the 4.6 million barrels of the other "oil" produced in 2011, 1.1 MMbopd were refinery gains, and another 0.6 MMbopd was the equivalent volume of oil corresponding to the production of roughly 0.9 MMbpd of ethanol. Biodiesel production was in the noise. I fear that EIA simply added volumes of the various fuels without converting them to oil equivalents based on a common oil density and heating value. The rest of the other "oil", 2.9 or 2.6 million barrels of oil equivalent (again I do not know how EIA made their conversions) were natural gas plant liquids and lease condensate. All of these liquids are significantly less dense than crude oil, and a proper conversion lowers their volume contribution by 25 percent.
Needless to say, refinery gains do not inject new energy into the U.S. economy, just add volume. Also, propane and butane are not crude oil, and ethanol is not a hydrocarbon. The only hard number here, 5.7 MMbopd of crude oil production is something to write home about. This level of production requires an incredible amount of new technology and technical skills that are available only in the U.S. My department graduates each year about 150 petroleum engineers of all levels, who make this huge effort such a smashing success. Their starting salaries are in excess of three-four times the national average for college graduates. And they all have jobs.
In conclusion, Russia is using similar technology to increase their rate of crude oil production to over 11 MMbopd, and Saudi Arabia is barely hanging in at 9-10 MMbopd. Both these countries also produce large volumes of lease condensates and natural gas plant liquids. The rate of U.S. crude oil production is a little more than 1/2 of either of these two rates, and we are no Russia or Saudi Arabia when it comes to producing oil per unit time. But this is just fine, so let’s stop deluding ourselves with such tenacity.
In the next blog, I will talk about the various techniques of denying existence of peak oil (or climate change, or anything else we fear or do not like).
P.S. So, did I miss anything in my discussion of the EIA quote at the top of this blog? Think carefully… Yes, I did.
In 2011, we consumed 18.8 MMbpd of petroleum products, less by 1.6 MMbpd than our consumption of petroleum products in 2005. With less cash in pocket, less driving, and more efficient cars, we have destroyed demand for almost as much of real crude oil as all other imaginary "oils" quoted by EIA and dutifully propagated through the clueless mediadom.
Why isn’t this achievement front-page news? We finally use less crude oil! We are more efficient! This incredible news is evidently not as sexy as making up imaginary "oil" to be on par with the Saudis. Have we gone mad?! I take it back: Have we stumbled even deeper into the destructive imperial madness that has infected us for the last 11 years?
And, you, corn ethanol lovers, read this and fear the future.
P.S.P.S. Five years after my well-researched plea to the EU Ministers of Environment and Transportation, EU is considering limiting use of biofuels:
The European Commission intends to limit the use of biofuels derived from food crops to 5% for transport fuel. This would be a substantial change to its present biofuels policy. According to the EU’s climate-change and energy commissioners, Europe wants to cap the share of energy in the transport sector from food crop-based biofuels at current levels. The proposal, a draft of which was reported by Dow Jones Newswires, clashes with the target of having 10% of the energy used in transport coming from renewable sources by 2020. This goal was set by the EU three years ago because food crop-based biofuels account for most biofuels available in volumes at the moment. New types of alternative fuels are being developed, but they are mostly at the laboratory stage. At the same time, biofuels are expected to be the main renewable energy source used in transport in 2020.
Despite the obvious insanity of the last sentence, I say: Better late than never, dear Europe, and much better than the U.S.A., which seems to have a policy of accepting political donations from mega agricultural companies and all kinds of other companies, rather than having an energy policy.
(P.S.)-cubed on 11/13/2012. The Wall Street Journal insists on an alternative reality view of EIA reporting, by stating in a Review&Outlook piece, "Saudi America," that:
The U.S. will increase its production to about 23 million barrels a day in 10 years from about 18 million barrels a day now, the IEA predicts.
I have no idea what IEA predicts, but I surely know that this number is incorrect, if it implies current production of liquid hydrocarbons in the U.S.A.


