
In a recent post, I discovered something rather alarming–the fact that in the last decade (2000 to 2010) both world energy consumption and the CO2 emissions from this energy consumption were rising as fast as GDP for the world as a whole. This relationship is especially strange, because prior to 2000, it appeared as though decoupling was taking place: GDP was growing more rapidly than energy use and CO2 emissions. And even after 2000, many countries continued to report decoupling.
I decided to sift through individual country results, to see if I could see a pattern emerging behind these changing results. When I did this, I found three major groupings of countries:
1. Southeast Asia, excluding Japan, Australia, and New Zealand. This group has been rapidly industrializing. In total, the group’s energy consumption has grown as rapidly as GDP in the last decade, and CO2 emissions have grown faster than GDP. This group includes China, India, Korea, Vietnam, and a long list of other countries in Southeast Asia, including nearby islands.
2. Middle Eastern Countries. This group showed energy use growing more rapidly than GDP, suggesting that it was taking more energy to extract oil and to pacify its population, over time. I included all countries in this group that BP includes in its Middle Eastern grouping, even though Israel (and perhaps some other countries) do not fit the pattern well.
3. Rest of the World. This group is the only group showing a favorable trend in energy growth relative to GDP growth, even in the last decade, although the pace of improvement has slowed. Two reasons for this favorable trend seem to be (a) continued growth of services, such as financial service, healthcare, and education, which use relatively little energy and (b) outsourcing of a major portion of heavy industry to Southeast Asia.
When we look at CO2 emissions broken out into these three categories, the shift over time is quite surprising:
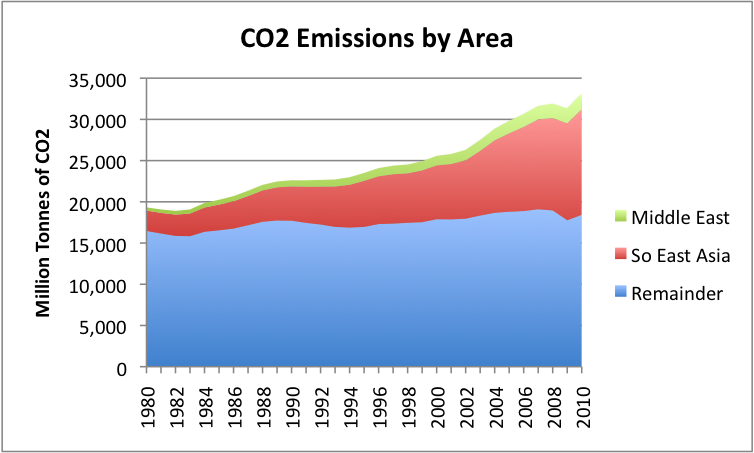
Figure 1. Carbon dioxide emissions emitted in year shown by the three major areas described (Southeast Asia, Middle East, Remainder), based on BP Statistical Data
The vast majority of the CO2 increase since 1980 has taken place in the Southeast Asia and the Middle Eastern areas!
The energy intensity of GDP (that is, the amount of energy consumed per trillion dollars of real GDP) has shown very different patterns for the three groups of countries:
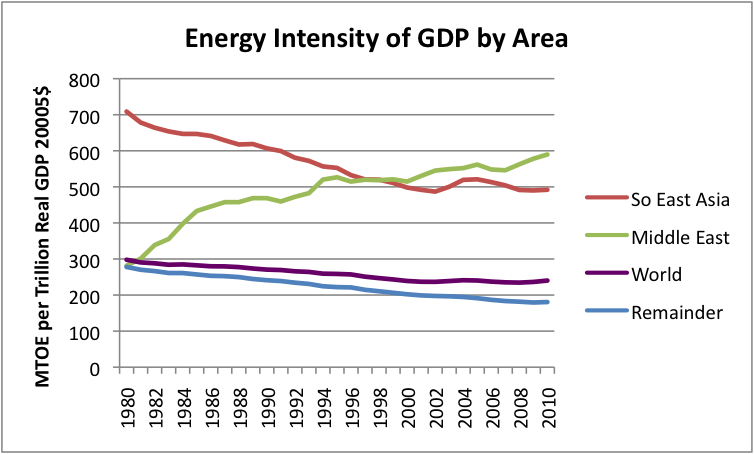
Figure 2. Energy Intensity of GDP by Area, based on BP Statistical Data regarding Energy Consumption in Barrels of Oil Equivalent, and USDA Economic Research Data regarding real GDP.
The world energy intensity of GDP has flattened in the last decade, reflecting a combination of the impacts of the three areas. The only area that has an improving energy intensity of GDP is the Remainder group. The Southeast Asia group is roughly flat. The Middle Eastern group is shows increasing energy use, relative to GDP growth.
Based on data in this post, I come to the following tentative conclusions:
1. The industrialization of Southeast Asia has allowed importers from around the world to reduce their energy intensity of GDP, but much of the savings has been offset by greater energy use (largely coal) in Southeast Asia. On a CO2 basis, we are likely worse off, because of this transfer.
2. There is no evidence that the Kyoto Protocol reduced worldwide CO2 emissions. In fact, to the extent that it encouraged outsourcing of industrial production to the Far East and made goods from the Far East more competitive, it may have contributed to rising world CO2 emissions. It would appear that a different approach is needed that recognizes the fact that fuels are part of a world market. Fuel savings in one part of the world are not necessarily helpful for the world as a whole.
3. In my view, world industrial production has self-organized in a way that assigns different roles to companies operating in the three country groups I described above, as a way to minimize manufacturing costs. Over the long term, this particular version of self-organization cannot continue. The Middle East will reach a point where its oil exports drop rapidly. Southeast Asia will reach maximums on coal production/imports and on pollution levels. The “Remainder” is already reaching limits in competing with Southeast Asia. Unemployment rates are high, manufacturing wages are low, and many workers lack the income needed to purchase additional services which might “grow” GDP.
Before leaving the breakdown into the three areas, I might mention that when one views energy consumption by area (Figure 3), changes in energy consumption for the three groups do not appear as extreme as changes in CO2 production (Figure 1).

Figure 3. Energy consumption by area, based on BP Statistical Data.
The results look even more like business as usual, when viewed on a real GDP basis (Figure 4), because GDP in the “Remainder” group is buoyed up by a large amount of GDP relating to services.
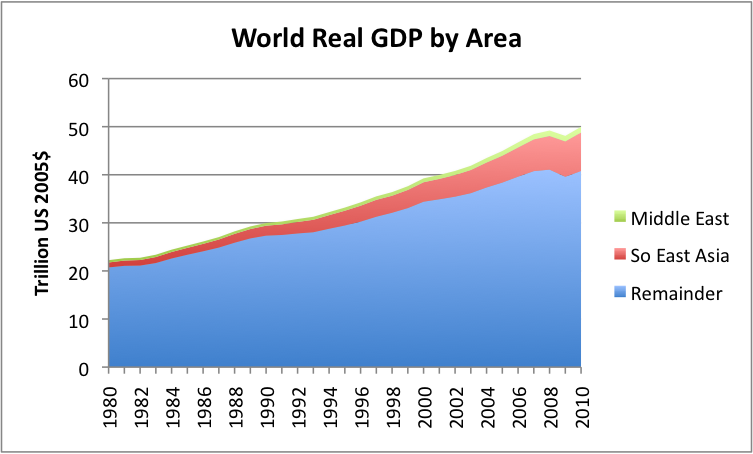
Figure 4. World real GDP by area, based on USDA Economic Research data.
Differences in Energy Use by Area
A person cannot help but be struck by the very different pattern in energy consumption by area. Southeast Asia’s energy use has grown by about 7% per year in the last decade, with coal being the primary source (Figure 5).
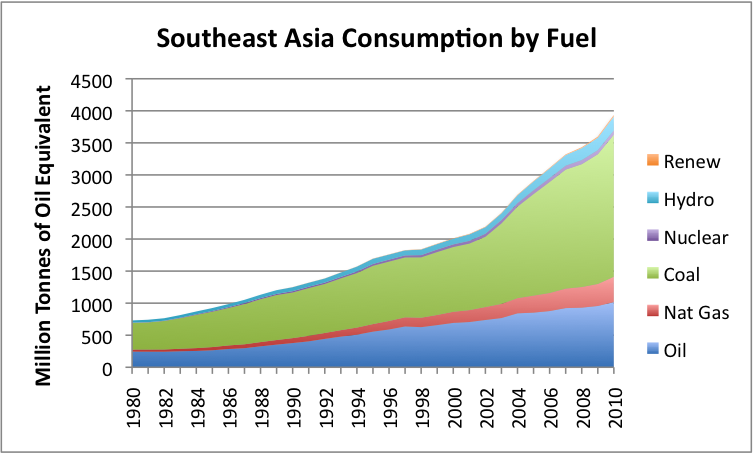
Figure 5. Southeast Asia’s energy consumption by fuel, based on BP Statistical Data.
Figure 5 indicates that coal use in Southeast Asia has especially grown since 2003.
The Middle East’s energy use has grown by a little more than 5% per year in the last decade. Its energy use is almost exclusively oil and natural gas (Figure 6).
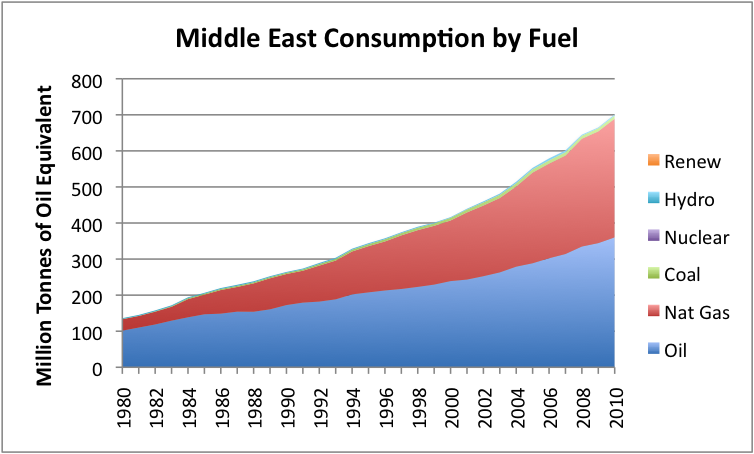
Figure 6. Middle Eastern energy consumption by fuel type, based on BP statistical data.
The Remainder grouping shows energy growth of less than 1% per year in the past decade, and a very different mix of fuels, including nuclear (Figure 7).
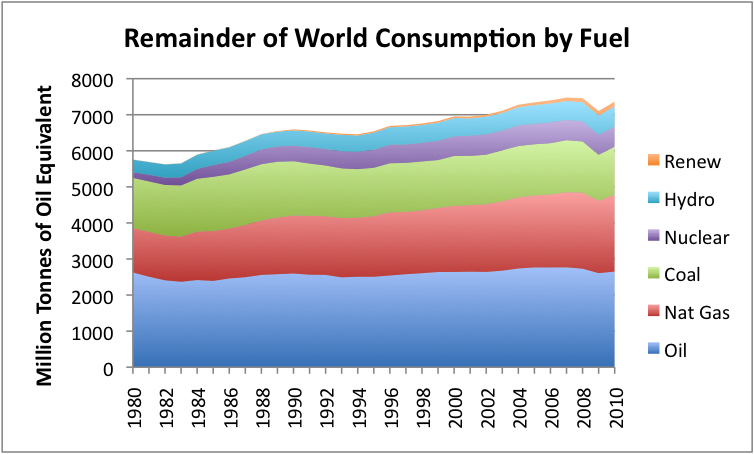
Figure 7. Consumption of energy by type for remainder of world, based on BP Statistical Data.
How the Fuel Consumption Market “Works”
This is my view of how the market works, in practice:
Middle East. Figure 8 shows recent oil production, consumption and exports.
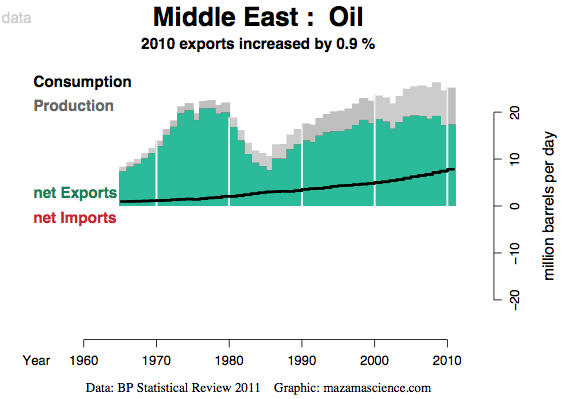
Figure 8. Middle Eastern oil production, consumption and exports, from Energy Export Data Browser, based on BP Statistical data. Note that total production is in grey; exports are green. Consumption is the heavy black line.
Because the Middle East has ready access to oil, it uses it freely–to provide social programs for large populations without jobs, and to aid in increasingly energy-intensive oil extraction. At the same time, Figure 8 shows that the total amount of oil extracted has been flat to declining, so oil exports have been declining. Since GDP is based mainly on oil exports, the result is that energy consumption is rising faster than GDP, unless oil prices happen to rise very rapidly.
Southeast Asia and Remainder. These two groups have taken two very different strategies:
1. The Remainder group has sought to minimize its oil use, and the use of fossil fuels in general, for a variety of reasons–to reduce the financial cost of imports, to minimize CO2 emissions, and to ensure “energy security” if the fuels should decline in availability. Coal is especially not favored, because of its high CO2 emissions.
2. The Southeast Asia group has chosen to try to produce economic growth through the export of manufactured goods, making use of its inexpensive labor force and the availability of cheap coal. Southeast Asia’s cost advantage is especially great in energy-intensive manufacturing, because coal is relatively cheap, and new factories often use the latest technology, limiting fuel use.
When other countries buy exports from Southeast Asia, it starts a whole chain of other economic activity as well–new roads, more concrete buildings, and more workers with a high enough salary to afford cars. So the impact of outsourcing is much greater than the energy directly used in producing the goods for export.
The Kyoto Protocol may have aided Southeast Asia in developing its export-oriented economy. Once CO2 goals were announced, it was clear that signatory countries would want to limit energy intensive manufacturing in their own countries. An easy way of doing this was to substitute the purchase of goods made in countries such as in Southeast Asia. The limits on carbon emissions also made it clear that Southeast Asia would experience relatively little competition for coal in the world marketplace, because countries that signed the Protocol would be limiting coal imports.
Furthermore, if Kyoto Protocol signators enacted carbon taxes, the taxes would tend to make Southeast Asian products (and services such as oil refining) even more cost-competitive than they otherwise would be, since similar manufacturing and services would face no taxes in Southeast Asia. And any oil that was saved by the Kyoto Protocol would be available on the world market at a slightly lower price, further helping Southeast Asia.
If there weren’t a world market in fossil fuels, and in goods made from fossil fuels (with no tariffs on them), the principles of the Kyoto Protocol would work very nicely. The problem is that the Kyoto Protocol doesn’t really address world market issues.
Why None of the Three Groupings Can Continue Its Current Strategy Indefinitely
Middle East. We know that because oil is a finite resource, eventually decline must occur. In fact, Figure 8 shows that oil exports may already have begun to decline in the Middle East, and this may be contributing to the unrest in the region. If exports are decreasing, it is difficult to maintain welfare programs unless oil prices rise to cover the funding gap.
It is not clear whether exports can be ramped up in the future. Saudi Arabia recently put plans on hold for a $100 billion expansion to 15 million barrels a day capacity by 2020. It also has delayed until 2014 its only other big expansion plan–a 900,000 barrel per day refinery that would allow it to use oil from the Manifa field. Given this situation, Saudi Arabia may see falling exports in the not-too-distant future.
Many have hopes for expansion of oil production by Iraq, but such expansion depends on maintaining peace in the country, which may be difficult. Furthermore, even if one country (namely Iraq) has adequate oil exports, other Middle Eastern countries may face unrest if their exports are declining, and oil prices do not rise enough to offset the impact of the decline.
Southeastern Asia. This part of the world is already encountering serious pollution problems. Air quality is notoriously bad, because of all the coal burned. A recent Science article reported that fully 90% of China’s shallow groundwater is polluted, and 37% of it is so foul it cannot be treated for use as drinking water.
While coal supplies are believed to be larger than oil supplies, they are not unlimited, and costs are already rising. Higher coal costs cause dislocations in the system. For example, costs of producing goods for export are higher, making them less competitive. Higher coal prices may also mean that domestic buyers have to cut back on other purchases, if they are to continue to purchase electricity and food that uses coal inputs.
Furthermore, Southeast Asia’s production is also dependent on the continued availability of oil exports, which cannot continue indefinitely.
So the current model of continued export growth cannot continue forever, and perhaps not for very long at all–a few years at most.
“Remainder” Countries. These countries have planned to outsource a significant share of their industrial production and purchase the products as imports. This approach only works if the population has jobs, and are rich enough to afford the imports. Increasingly, this seems not to be the case.
Another part of the strategy in “Remainder” countries is continued growth of services. This growth of services works only as long as citizens have jobs that pay enough that they can afford ever-increasing amounts of services. A recent article in the Wall Street Journal called Holding Off on Haircut to Buy a New Car points out that increasingly that is not the case. Figure 9 was attached to illustrate the issue:
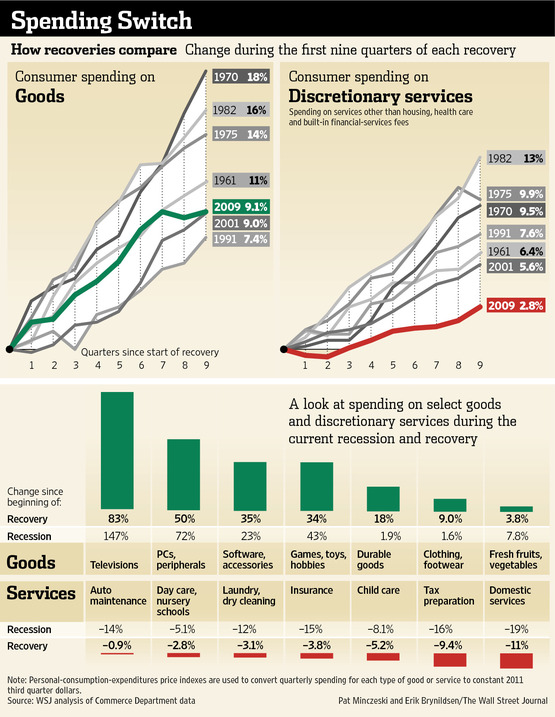
Figure 9. Illustration from the Wall Street Journal, November 25, 2011. Note that the red and green bars at the bottom of the graph are percentage changes since the beginning of the recovery. Percentage changes are also shown (but not graphed) relative to the beginning of the recession.
This shrinkage in growth of services would seem to explain the convergence of US GDP growth and energy use growth in the last few years as shown in Figure 10.
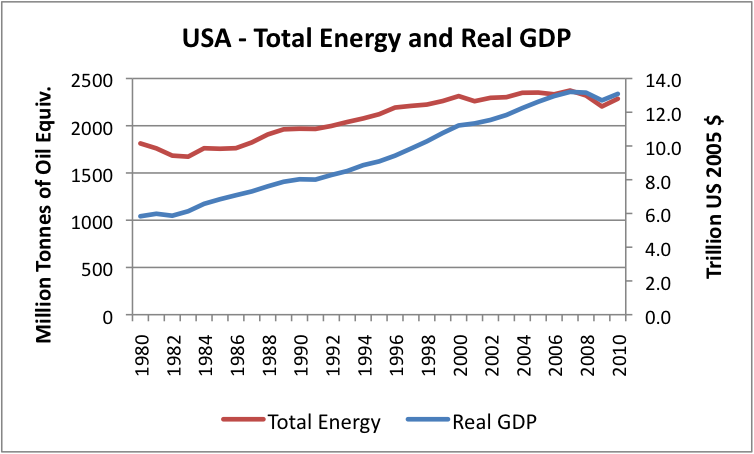
Figure 10. USA growth in real GDP and growth in energy consumption
A New Model
Our current system of creating and trading goods is not the creation of any single government. Instead, there is a huge network of rules set forth by governments and organizations around the world, that has evolved over time. There is an even larger number of businesses and individuals making decisions based on these rules. The system is in many respects self-organized, because businesses try to make a profit within this system, and organize themselves in the best way they can, given the rules they have been given to work with.
Our problem now is that we need a new system, but it is not easy to co-ordinate all of the changes in rules that would be needed around the world to create such a system. In fact, it would be virtually impossible to put together the right set of rules, because it is impossible to foresee all of the indirect impacts and feedbacks that would occur within the new system as the new rules take effect. A system almost of necessity needs to be designed piecemeal and to evolve slowly over time.
The system we have now takes many things for granted, such as the long-term availability of fossil fuels, and that we will always be able to have enough jobs for workers. These assumptions are proving not to be true. Furthermore, it wasn’t until fairly recently that we recognized CO2 emissions might be a problem. What we need now is a new model, with a complex set of new rules, but it is hard to see how we can get to that point. We can’t rely on any single rule–even the Kyoto Protocol–to get us to where we need to be.
This article originally appeared on Our Finite World.
Gail Tverberg has an M. S. from the University of Illinois, Chicago in Mathematics, and is a Fellow of the Casualty Actuarial Society and a Member of the American Academy of Actuaries. (More)

This work is licensed under a Creative Commons Attribution-Share Alike 3.0 United States License.