
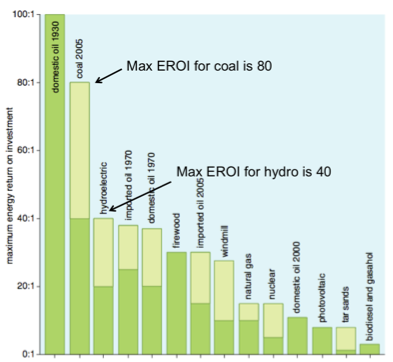
Hall and Day (2009) report that the EROI for coal might be as high as 80 and that for hydropower, EROI is 40. Does this mean that coal is twice as ‘good’ as hydro? The answer is no, and in this post I will discuss how this relates to the idea of an EROI Threshold.
The Net Energy Cliff
This post is based on a presentation that I gave at the recent ASPO conference on November 4th, 2011.
We must first realize that EROI is a somewhat theoretical concept; it is a unitless ratio that does not describe actual flows of energy. What society really cares about, and what is really used to grow economies around the world, are actual flows of energy. More precisely, the economy utilizes flows of net energy. What, if anything, can EROI tell us about the flow of net energy?
To understand how EROI influences the flow of net energy, we must first look at the equation for both net energy and EROI, which are:
Net Energy = Eout – Ein
EROI = Eout/Ein
If we solve the EROI equation for Ein and substitute it into the Net Energy equation, we get:
Net Energy = Eout*((EROI-1)/EROI)
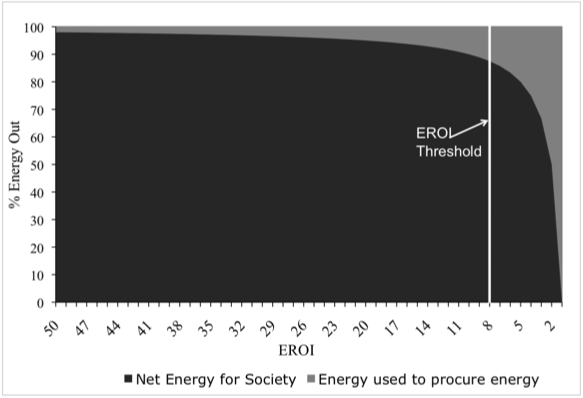
From this equation Mearns (2008) created the “Net Energy Cliff” graph. The net energy cliff figure relates the percent of energy delivered as net energy (y-axis, dark grey) and the percent of energy used to procure energy (y-axis, light grey) as a function of EROI (x-axis).
The Net Energy Cliff
The exponential relation between net energy and EROI creates what I am calling an EROI Threshold at roughly 8. Due to the asymptotic nature of the curve at high EROIs, there is little difference in the actual flow of net energy delivered from technologies that have EROIs above 8. The corollary is that extraction/conversion processes with EROIs below 8 result in vastly different flows of net energy.
For example, a drop in the EROI of oil extraction from 50 to 10 would result in a change in net energy flow from 98% (of the gross energy flow) to 90%. Yet, a drop in EROI from 10 to 2 would result in a net energy change from 90% to 50% of the gross energy flow.
This means that the relevance of EROI as a meaningful comparison of extraction/conversion technologies decreases as EROI increases. This is also the reason why I stated in the beginning of the article that coal, with an EROI of 80, is not twice as good as hydro, with an EROI of 40, because the actual difference in the flow of net energy between these two is very small. The truth is that they both deliver well over 90% net energy. What this threshold effect means is that, when substituting renewables for fossil fuels, it is less important to match EROIs (i.e. substituting coal for a renewable that also has an EROI of 80), and more important to focus simply on avoiding very low EROI technologies (EROI < 8).
Major Caveat to the EROI Threshold
There is one major caveat to this discussion. The logic behind the EROI Threshold only applies if the EROIs being compared are actually commensurable: i.e. that the EROI analyses utilize the same set of assumptions. This is often, however, not the case.
One significant difference between the EROIs calculated for fossil fuels and that for renewable technologies results from the intermittent nature of renewable energy. It is commonly thought that scaling renewable energy will require the adoption of some sort of storage system to account for times of over- and under-production. The EROI of wind or solar PV will surely decrease if we allocate the energy costs of those storage systems to the solar PV or wind conversion process. The question is whether this added energy cost will decrease the EROI of these systems below the EROI threshold, but to my knowledge, there are no peer-reviewed papers reporting EROI numbers that included these costs.
Bottom-Line
EROI is a useful metric for comparing across energy extraction/conversion technologies, or for comparing the extraction/conversion process of one resource over time. But as EROI increases, and especially as it increases much beyond 8, its relevance, as it pertains to net energy flows, fades. Furthermore, due to the aggregated nature of the EROI statistic, every analysis involves assumptions. It is important that those who use these EROI statistics understand what those assumptions are and what they indicate about the utility of the EROI statistic produced.
References
1.Hall, C.A.S.; Day, J.W., Revisiting the limits to growth after peak oil. American Scientist 2009, 97, 230-237.
2.Mearns, E. In The global energy crises and its role in the pending collapse of the global economy, Royal Society of Chemists, Aberdeen, Scotland, October 29th, 2008; Aberdeen, Scotland, 2008.

This work is licensed under a Creative Commons Attribution-Share Alike 3.0 United States License.


