Abstract
The energy payback time of photovoltaic (PV) cells has been a contentious issue for more than a decade. Some studies claim that the joule content of the energy and materials that were put into the process of making the PV cell, will be equaled by the joule content of the electrical output of the cell within a few years of operation. Other studies claim that the useful electrical energy output of the PV cell will never exceed the total amount of useful energy contained within all the inputs of the manufacturing, installation and lifetime operating processes of the PV cell. These studies are often loosely referred to as measuring the energy “payback” of the PV cell. This study undertook a literature review to determine the key assumptions and considerations included in PV Life Cycle Analysis (LCA) modelling. In addition, other forms of modeling such as embodied energy (EE) analysis have also been considered. This review has concluded that the likely energy payback of a typical domestic sized rooftop grid connected PV cell is approximately four years. In addition, it was estimated that larger utility PV cell power stations would have a much longer energy payback period.
Description of Abbreviations
sc-Si Single-crystalline silicon
mc-Si Multi-crystalline silicon
a-Si Amorphous silicon
BOS Balance of System components (including mounting materials and structures, Inverters, cables and control electronic devices)
Introduction
Previously published estimates for the energy requirements of present day crystalline silicon modules vary considerably. As noted in Alsema (2000), these differences can partly be explained by different assumptions for process parameters, but they mostly appear to arise from estimates for the silicon purification and the crystallisation process. The majority of silicon solar cells are made from off-spec material rejected by the micro-electronics industry, which introduces the question of whether to include process steps required for micro-electronics wafers in the energy requirements for the PV modules. In order to attempt to draw some conclusions as to the actual energy payback time of PV cells, several previous studies were reviewed. A summary of their findings is presented in table 1. These studies are all based on different assumptions, and evaluate different types of modules, and therefore cannot be directly compared. Some key assumptions of each study are shown. Please refer to the original articles for more detailed information.
Table 1. Summary of energy payback periods found by reviewed literature
Author |
Low Estimate (years) |
Low Estimate Key Assumptions |
High Estimate (years) |
High Estimate Key Assumptions |
|
Alsema (2000). |
2.5 |
Roof mounted thin film module |
3.1 |
Roof mounted mc-Si module |
|
Alsema. & Nieuwlaar (2000) |
2.6 |
Thin film module |
3.2 |
mc-Si module |
|
Battisti & Corrado (2005). |
1.7 |
Hybrid photovoltaic / thermal module |
3.8 |
Tilted roof, retrofitted mc-Si module |
|
Jester (2002). |
3.2 |
150W peak power mc-Si module |
5.2 |
55W peak power mc-Si module |
|
Jungbluth, N. (2005). |
4 |
mc-Si module if emissions are not taken into account |
25.5 |
sc-Si module if emissions are taken into account |
|
Kato, Hibino, Komoto, Ihara, Yamamoto & Fujihara (2001). |
1.1 |
100MW/yr a-Si, modules including BOS |
2.4 |
10MW/yr mc-Si module including BOS |
|
Kato, Murata & Sakuta (1997) |
4 |
Sc-Si module. Excludes all processes required for micro-electronics industries. |
15.5 |
sc-Si module. Includes all processes required for micro-electronics industries. |
|
Kato, Murata & Sakuta, (1998). |
1.1 |
a-Si module. Excludes all processes required for micro-electronics industries. |
11.8 |
sc-Si module. Includes all processes required for micro-electronics industries. |
|
Knapp & Jester (2001). |
2.2 |
Production thin film module |
12.1 |
Pre-pilot thin film module |
|
Lewis & Keoleian (1996). |
1.4 |
36.7 kWh/yr frameless a-Si module located in Boulder, CO |
13 |
22.3 kWh/yr a-Si module with frame located in Detroit, MI |
|
Meijer, Huijbregts, Schermer & Reijnders (2003). |
3.5 |
mc-Si module |
6.3 |
Thin-film module |
|
Pearce & Lau (2002). |
1.6 |
a-Si module |
2.8 |
sc-Si module |
|
Peharz & Dimroth (2005). |
0.7 |
FLATCON (Fresnel-lens all-glass tandem-cell concentrator) module – 1900 kWh/(m2 yr) insolation |
1.3 |
FLATCON (Fresnel-lens all-glass tandem-cell concentrator) module – 1000 kWh/(m2 yr) insolation |
|
Raugei, Bargigli & Ulgiati (2005) |
1.9 |
CdTe module including BOS |
5.1 |
mc-Si module including BOS |
|
Schaefer & Hagedorn (1992). |
2.6 |
25 MWp a-Si module |
7.25 |
2.5 MWp sc-Si module |
|
Tripanagnostopoulos, Souliotis, Battisti & Corrado (2005). |
1 |
Glazed Hybrid photovoltaic / thermal |
4.1 |
Unglazed Hybrid photovoltaic / thermal |
Key Considerations
Many of the studies reviewed, such as Battisti and Corrado (2005) or Raugei et al (2005) utilise accepted standardised methodologies such as Life Cycle Assessments (LCA), Embodied Energy (EE) analyses, Emergy Analyses, and Material Flow Accounting in their analyses. LCA methodology, for example, is governed by ISO (International Organization for Standardization). Some studies, however, use methods that are scientifically incorrect, for example attempting to treat different forms of energy as equal. In any embodied energy calculation, it is important to utilise realistic conversion factors when comparing one form of energy with another. The joule contents of differing forms of energy are not equal and the assumption of 100% conversion efficiency between energy forms is inaccurate. In order to adequately account for this, all energy sources need to be related on some common basis through accepted conversion factors.
The system boundaries for such embodied energy and LCA calculations can also become problematic to define. Many studies only consider electrical energy directly required for a particular process. However, when losses related to electrical generation, conversion and transmission are considered the energy actually required for the process might be considerably greater. Another factor that previous studies commonly fail to account for is human inputs, e.g. skilled education, labour, administration, maintenance etc. In order for any embodied energy calculation to be complete, all inputs must be accounted for.
This is an issue with the use of all LCA data. Care must be taken to ensure the user is comparing like with like within different studies and the boundaries of the study are the same. Ultimate certainty of inputs is not yet possible due to the wide uncertainties in environmental accounting. This paper deals with these issues by allocating a range within which the energy payback for PV systems is likely to occur.
Key studies influencing the debate
One of the studies reviewed, Alsema (2000), is a commonly referenced study claiming short energy payback periods. This study reviewed and compared ten previous studies to establish on which data there is reasonable consensus and how observed differences may be explained. Based on this review of available data, Alsema established a `best estimate’ of the energy requirement of multi-crystalline silicon (mc-Si), single-crystalline silicon (sc-Si) modules, thin film modules and balance of system (BOS) components. The study attempted to address several considerations outlined above. Key assumptions and methods used by Alsema are:
- Energy data is presented on a common basis as Equivalent Primary Energy units, that is the amount of primary energy (or fuel) necessary to produce the component.
- Electrical energy input is converted into primary energy requirements with an assumed efficiency of 35%.
- Process steps which are specifically needed for the micro-electronics wafers are disregarded
- Lower estimates for process energy consumption are used with the argument that lower quality requirements may lead to reduced energy consumption.
- Mc-Si, sc-Si and thin film modules are assumed to have efficiencies of 13, 14, and 7 percent respectively.
- The systems are assumed to receive an irradiation of 1700 kWh/m2/yr and have a performance ratio of 0.75.
Alsema’s findings for different module types are shown below:
Table 2: Energy Payback Times found by Alsema
|
Module Type |
Energy Requirement module only (MJ/m2 module) |
Energy Requirement module with frame (Al) , supports, and inverter (MJ/m2 module) |
Payback Time (years) |
|
mc-Si |
4200 |
5400 |
3.2 |
|
Sc-Si |
5700 |
6900 |
Not shown |
|
Thin Film |
1200 |
2400 |
2.7 |
PV cells are estimated to have a lifespan of 25-30 years, therefore repaying their embodied energy tenfold over their lifetime, according to Alsema’s estimate. Alsema also predicts that payback times will decrease to 1-2 years by 2010, and even below this by 2020, based on technological advances.
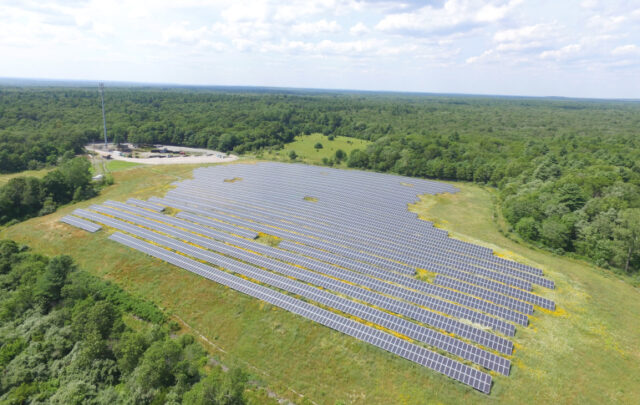
Other studies, however, claim that the energy payback of PV cells is much lower than Alsema. For example, in contrast the most commonly cited (indeed possibly the only) study claiming that the energy payback time of PV modules exceeds their lifetime is Howard Odum’s “Emergy” analysis of solar cells in his book Environmental Accounting (1996). No published studies were found that referenced Odum’s work in relation to photo-voltaics, but his work is widely cited in less formal arenas such as web forums and has contributed to the view that PV modules are unable to payback their embodied energy over their lifetime. Emergy accounting has been shown to be an effective tool in whole-systems analysis and tries to evaluate the work previously required to generate a product or service. Odum evaluates a utility scale solar voltaic power installation in Austin, Texas, and concludes that the installation uses nearly twice as much “emergy” as it creates over its lifetime.
Upon scrutiny, there are two reasons why these findings can be rejected as indicating that PV modules are unable to payback their embodied energy over their lifetime:
- The installation was a large centralised power plant. The embodied energy in the concrete and other structures was greater than the PV cells themselves. Frameless modules mounted on existing structures or roofs eliminate the majority of this requirement and its associated embodied energy.
- The human labour of a team of highly trained engineers required to design, operate and maintain the plant were large portions of the energy requirement. De-centralised roof-mounted systems also eliminate nearly all of this, as they require very low maintenance after installation. The embodied energy in design is also negligible due to amortization over lengthy production runs.
Analysis
Most published studies came to conclusions similar to those of Alsema (2000). There are, however, several important factors these studies neglect. Odum’s (1996) methodology does at least attempt to account for embodied energy within a much larger system boundary, and to account for a wider range of inputs than other published studies. In order to come to our own estimate on the actual energy payback time, Alsema’s findings were used as a basis and any factors not already accounted for were added to his figures.
The primary additional factor was human labour. Human labour associated with the construction and operation of the PV plant would be spread over thousands of PV modules, and would thus be negligible per m2 of PV. It was decided, however, that labour for installation of each system would be significant and should thus be included. Based on Odum’s (1996) Environmental Accounting, embodied energy of human service contributions can be handled in different ways. Two methods are presented – evaluating metabolic energy (usually giving insignificantly small figures), or national fuel share per person. Fuel use per capita (USA values – but estimated to be similar to Australian values) gave the highest value, so in the interest of caution this figure of 967 MJ per worker per day was used. It was estimated that one tradesman would require one whole working day to install a typical small roof-mounted system.
As previously mentioned, realistic energy conversion factors are another item commonly omitted from previous studies. Accurately including this however, is not simple. Exactly what is a realistic conversion factor depends on the energy generation and transmission system in question and a myriad of other factors that are difficult to define or to agree upon. Although it is acknowledged that some may view it as an overly optimistic figure, the 35% conversion efficiency used by Alsema was taken to be an acceptable simplification for the purposes of this study given that the average conversion efficiency of conventional Australian power stations is 35-38% (CSIRO).
The rated electrical output of the PV cells examined in Alsema’s study were not quoted, so the energy payback time could not be re-calculated from scratch. Instead, the adjusted energy payback times were calculated using the ratio by which the total embodied energy increased. For example, it was assumed that if the embodied energy increased by 50%, the energy payback time would also increase by 50%.
The 967MJ required for one days labour was rounded to 1000MJ. This was added to the total embodied energy requirements for each type of module, and the new payback time was calculated accordingly. The results are shown in table 3.
Table 3: Adjusted Energy Payback Times.
|
Module Type |
Alsema: Energy Requirement module with frame (Al) , supports, and inverter (MJ/m2 module) |
Adjusted: Energy Requirement module with frame (Al) , supports, inverter, and human labour (MJ/m2 module) |
Alsema: Payback Time (years) |
Adjusted: Payback Time (years) |
|
mc-Si |
5400 |
6400 |
3.2 |
3.8 |
|
Sc-Si |
6900 |
7900 |
Not shown |
|
|
Thin Film |
2400 |
3400 |
2.7 |
3.8 |
This estimate of four years may be seen to be optimistic by some, yet many of the figures used by Alsema are in fact cautious estimates. For example, Alsema’s figures used in the study were based on 1999 technology. Alsema has forecast the embodied energy to dramatically reduce by 2010. They also include Aluminium frames on all modules, which account for a large amount of the embodied energy, and are no longer necessary in newer models. Taking these considerations into account, payback time for 2006 modules could be as low as 2-3 years. On the other hand, there are many factors that are difficult to fully account for. Taking a devils advocate stance even assuming double this payback time (6-8 years) still provides a significant energy payback over the proven minimum effective 25 year life of small scale PV systems.
Conclusions
Through evaluating a range of previously published studies claiming very different energy payback times, this study has attempted to draw some conclusion as to the actual energy payback time of PV modules. Alsema’s (2000) study provided a “best estimate” based on several other existing studies. Further embodied energy factors were added to Alsema’s figures. An energy payback time of around four years was found for both mc-Si and thin film modules. Major limitations to the accuracy of this assessment are the difficulties in determining realistic energy conversion factors, and in determining realistic energy values for human labour. For this reason an allowance of up to 100% has been allowed, thus the range of payback is between 2-8 years. Thus small-scale roof mounted PV systems have a positive energy payback and are capable of contributing to a sustainable energy future.
REFERENCES
| Alsema E. (2000). Energy Pay-back Time and CO2 Emissions of PV Systems. Progress in Photovoltaics: Research And Applications, 8, 17-25. |
| Alsema. E. Nieuwlaar, E. (2000). Energy viability of photovoltaic systems. Energy Policy, 28, 999-1010. |
| Battisti, R. Corrado, A. (2005). Evaluation of technical improvements of photovoltaic systems through life cycle assessment methodology. Energy, 30, 952–967. |
| CSIRO, Advanced Gasification Research Facility, Queensland Centre for Advanced Technologies, http://www.cat.csiro.au/3_4.htm |
| Jester, T. (2002). Crystalline Silicon Manufacturing Progress. Progress in Photovoltaics: Research and Applications, 10, 99–106. |
| Jungbluth, N. (2005). Life Cycle Assessment of Crystalline Photovoltaics in the Swiss ecoinvent Database. Progress in Photovoltaics: Research and Applications, 13, 429–446. |
| Kato, K. Hibino, T. Komoto, K. Ihara, S. Yamamoto, S. Fujihara, H. (2001). A life-cycle analysis on thin-film CdS/CdTe PV modules. Solar Energy Materials & Solar Cells, 67, 279-287. |
| Kato, K. Murata, A. Sakuta, K. (1997). An evaluation on the life cycle of photovoltaic energy system considering production energy of off-grade silicon. Solar Energy Materials and Solar Cells, 47, 95-100. |
| Kato, K. Murata, A. Sakuta, K. (1998). Energy Pay-back Time and Life-cycle CO2 Emission of Residential PV Power System with Silicon PV Module. Progress in Photovoltaics: Research and Applications, 6, 105-115. |
| Knapp, K. Jester, T. (2001). Empirical Investigation of the Energy Payback Time for Photovoltaic Modules. Solar Energy, 71, 165–172. |
| Lewis, G. Keoleian, G. (1996). Amorphous Silicon Photovoltaic Modules: A Life Cycle Design Case Study. National Pollution Prevention Center, School of Natural Resources and Environment, University of Michigan. |
| Meijer, A., Huijbregts, M., Schermer, J. Reijnders, L. (2003). Life-cycle Assessment of Photovoltaic Modules: Comparison of mc-Si, InGaP and InGaP/mc-Si Solar Modules. Progress in Photovoltaics: Research and Applications, 11, 275–287. |
| Odum, H. (1996). Environmental Accounting: Emergy and Environmental Decision Making. John Wiley & Sons, New York. |
| Pearce, J., Lau, A. (2002). Net Energy Analysis for Sustainable Energy Production from Silicon Based Solar Cells. Proceedings of Solar 2002 Sunrise on the Reliable Energy Economy June 15-20, 2002, Reno, Nevada |
| Peharz, G., Dimroth, F. (2005). Energy Payback Time of the High-concentration PV System FLATCON. Progress in Photovoltaics: Research and Applications, 13, 627–634. |
| Raugei, M. Bargigli, S. Ulgiati, S. (2005). Energy and Life Cycle Assessment of Thin Film CdTe Photovoltaic Modules. Energy and Environment Research Unit, Department of Chemistry, University of Siena, Italy. |
| Schaefer, H. Hagedorn G. (1992). Hidden Energy and Correlated Environmental Characteristics of P.V. Power Generation. Renewable Energy, 2, 15-166. |
| Tripanagnostopoulos, Y. Souliotis M. Battisti R. Corrado A. (2005). Energy, Cost and LCA Results of PV and Hybrid PV/T Solar Systems. Progress in Photovoltaics: Research and Applications, 13, 235–250. |


