The other day, I was arguing:
We are in an era where the availability of natural resources is not sufficient to support the wealth levels that the developed world has grown accustomed to, along with the speed of growth with which the developing world is trying to approach those same levels. So, this is represented by oil prices rising (along with food and other commodity prices more generally). But the effect of this is not to place a uniform drag on growth, because the global mind has not accepted this truth yet. Instead, the global economy keeps trying to grow in a way that is inconsistent with the resource constraints, and then some part of the system tears and gives way.
So, in 2007/2008 the sector that gave way was the American subprime consumer, along with a significant chunk of the financial system that was predicated on the idea that poor Americans could continue to take on more and more debt indefinitely. Instead, rising gas and food prices eventually destabilized the finances of that sector of consumers, they started to default, then their lenders started to default, financial contagion set in, and the situation was only stabilized with massive extraordinary interventions by sovereign governments. That worked, but left a lot of the sovereigns in significantly weaker condition than before.
Now poor Americans borrowing more and more to bid house prices higher and higher was always an unsustainable trend that was going to end in tears one way or another. But the timing was likely determined by the oil/food price shock that ended in 2008.
So now, just three years later, here we are again with oil and food prices rising fast, and the question in my mind is this: what part of the global fabric tears next? And when?
Some readers were skeptical, with commenter Nick G saying:
“rising gas and food prices eventually destabilized the finances of that sector of consumers, they started to default, then their lenders started to default”
I’ve seen this said often on TOD, but I’ve seen no proof of it. As best I can tell, the housing bubble simply reached an unsustainable level and popped pretty much of it’s own accord – at a certain point 1) it was not possible to find a “greater fool” to buy empty spec houses and 2) ARM resets revealed that home buyers could not afford their loans, regardless of minor changes in their gas and food expenses.
That inspired me to look for a more systematic way to illustrate the relationship between energy prices and US recessions. I’m focussing on the US because it has a large economy and the records go back for a long time. (Well, it probably has to do with me living here too). I used the standard NBER recession dates. For energy prices, after some poking around, I settled on using data from FRED for the “Producer Price Index for Fuels and Related Products and Power (PPIENG)”. You might wonder why I didn’t use something more obvious like oil prices, and the reason is that I couldn’t find a monthly oil price series that goes back before the 1970s. The PPIENG series goes back to 1926, and is monthly, allowing us some decent time resolution while looking at a larger sample of recessions.
Then for each recession, I took the PPIENG from 24 months prior to the onset of the recession up to the end of the recession (they vary considerably in length). I rescaled it to be 100 at the onset of recession.
If we look at all the data together, it’s rather confusing:
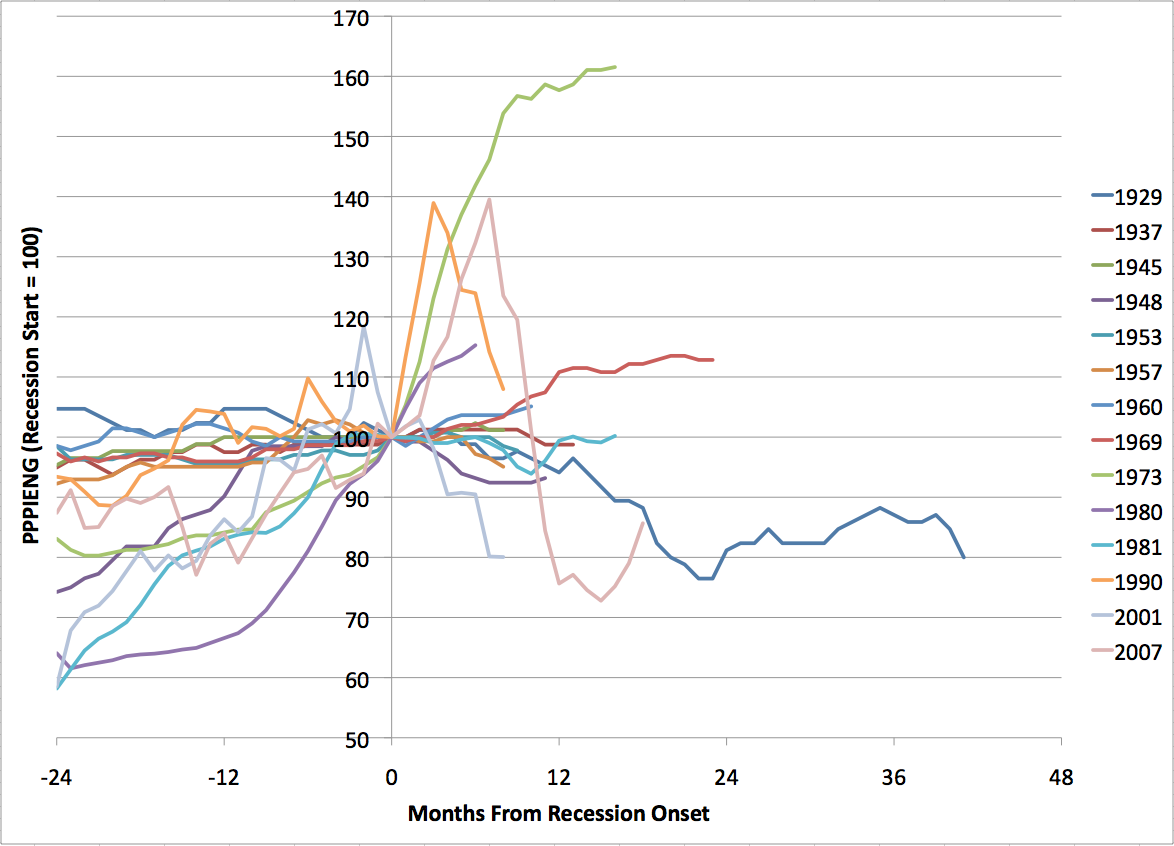
(The recessions are labelled by the year in which they began).
However, the data simplify a lot if we break them into two time periods. For the recessions prior to 1973, we get this:
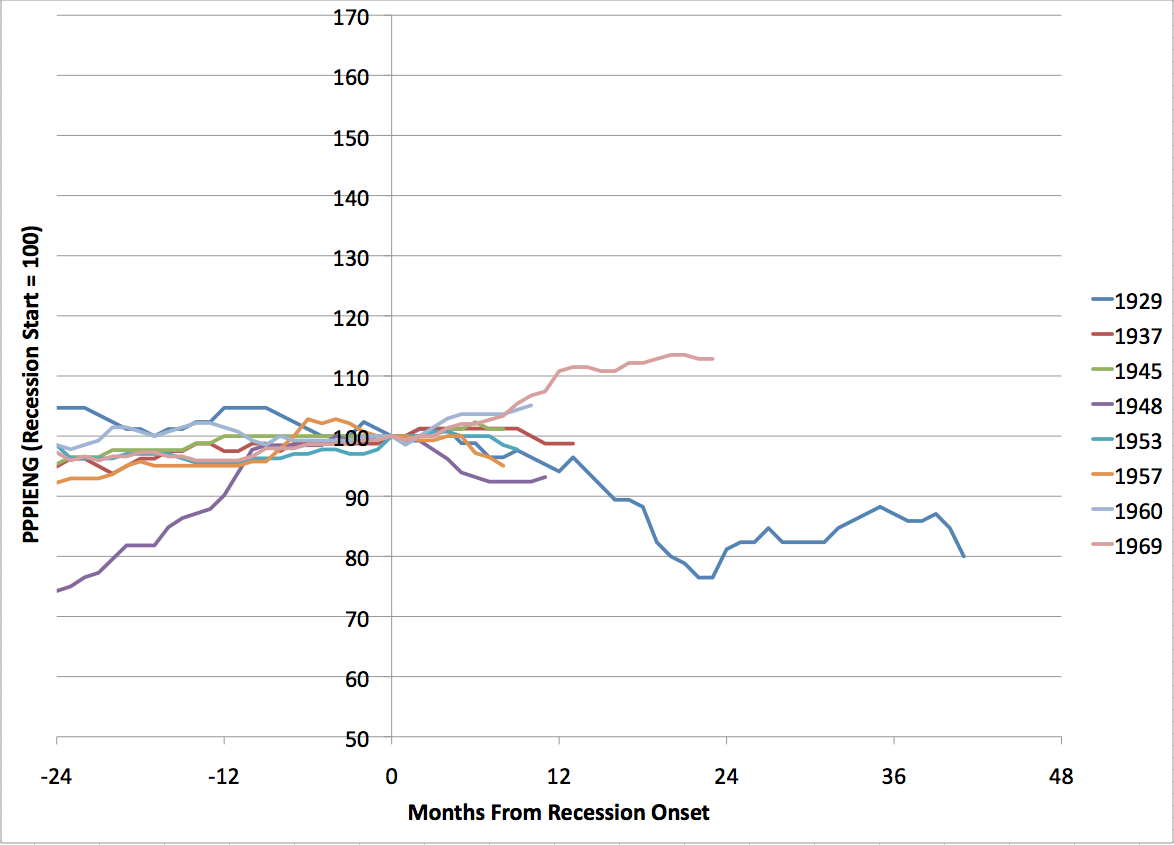
Clearly, you’d have to say that rises in energy prices were not a major factor in the lead-up to recessions in that era (with the possible exception of the 1948 recession).
However, it’s a totally different story for all the recessions from 1973 on:
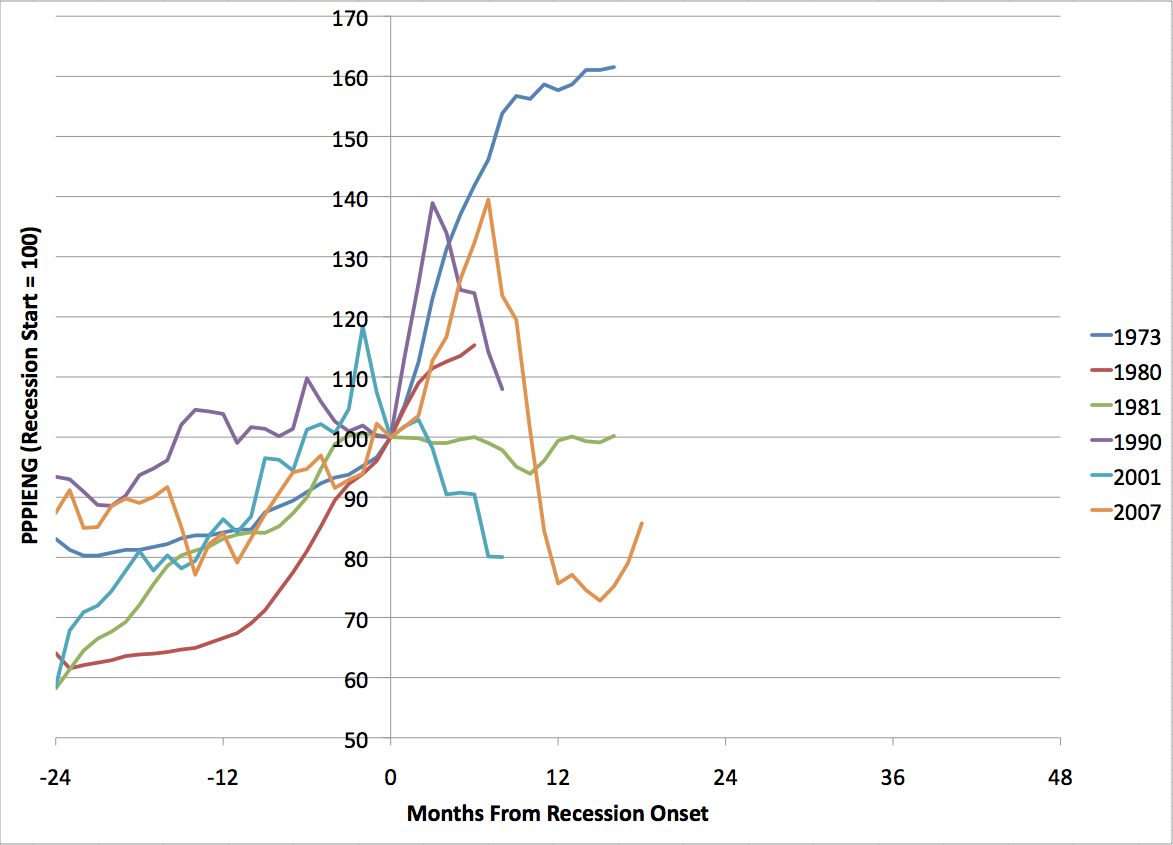
In every case, energy prices were rising either before or immediately at the onset of the recession, and in every case they “broke” in some sense before the recession was over – either declining, or at least sharply slowing in growth. The paradigm case is 1973 where energy prices were rising steadily and then a huge oil shock coincides with the start of the recession, which only ends after prices have stabilized. However, even in cases like 2001 where most of us would think that energy prices had relatively little to do with the recession, there is a pattern that they were growing rapidly before the recession, and then broke near the start of it.
The least clear case here is 1980, where the lead-in to the 1981 recession overlaps with the 1980 event, and you could argue they are really one phenomenon.
So I would argue that this data is at least consistent with the narrative that, in the post 1973 era, energy is consistently in somewhat problematic supply, and you can think of many of the recessions as showing a pattern in which energy prices are rising as the world overshoots what can currently be supplied, or what can currently be supplied drops as a result of geopolitical events, and energy prices rise until some pre-existing weakness in the global economic fabric tears in the course of a recession, and prices fall back again. In some cases, perhaps, like 2001, the thing was about to tear on its own anyway, and energy prices fall almost immediately at the onset the recession. In other cases, like 1990 or 2007, it perhaps wasn’t quite ready to tear, and energy prices had to rise substantially more before finally breaking.
Obviously, this is necessarily rather anecdotal, since we only have six data points.
If we look at trough to peak change in energy prices in these intervals, the factors are as follows: 1973: 2.0, 1980: 1.9, 1981: 1.7, 1990: 1.6, 2001: 1.9, 2007: 1.6. This is a crude indicator, since in some cases the trough was clearly before the start of my 24 month lead-in, and I didn’t go back before that interval. I also didn’t make any attempt to correct for general monetary inflation, which is not a constant across these episodes. Still, it’s probably a robust pattern that a change in PPIENG of around 50-100% is associated with the onset of post 1970 recessions.
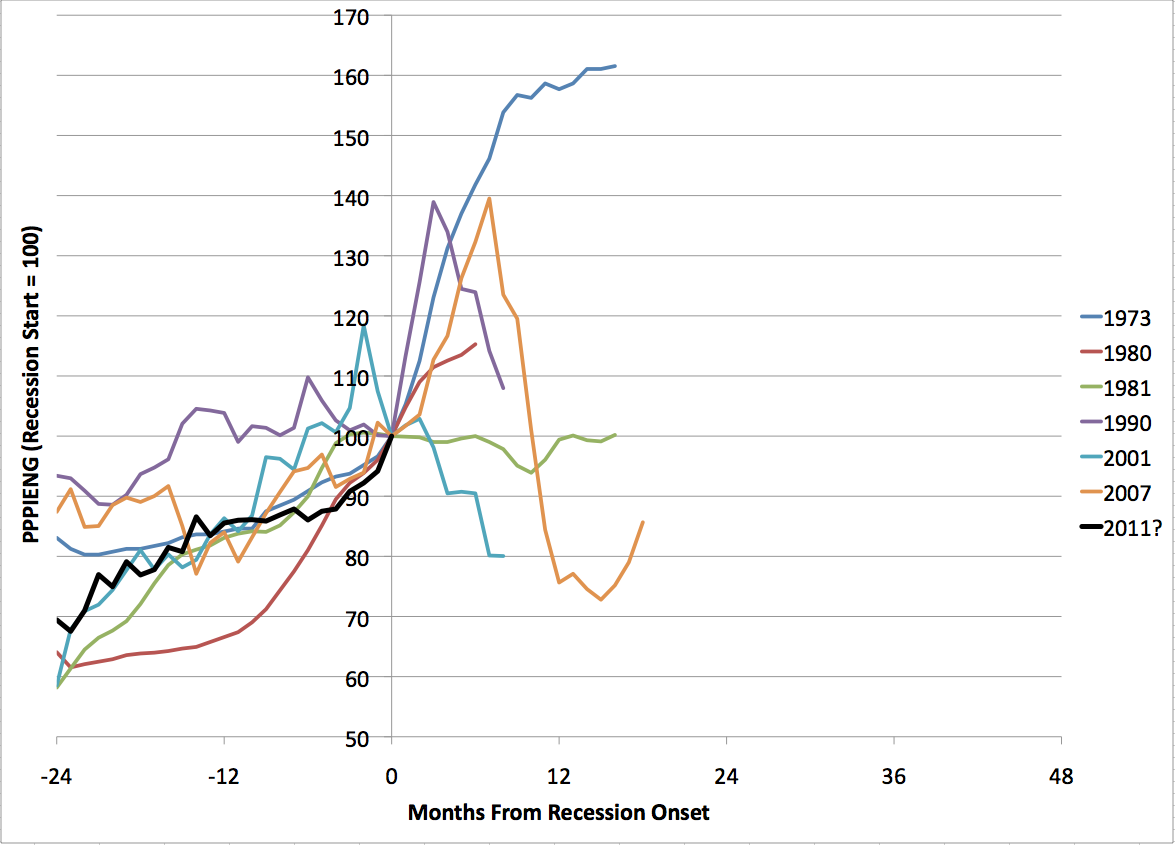
So, what about the present. Well, suppose, hypothetically, you wanted to think of March 2011 as the onset of the next recession. In the context of the other post 1970 recessions, that would look like:
At the present time, there’s a 48% increase from trough to present in PPIENG. So that’s just off the lower end of the historical range, but getting there.
I stress that I’m not saying that a recession started as early as March 2011 – I doubt that.
But it might not be very far off. I think it all depends on what happens next. I doubt energy prices can go a whole lot higher without triggering another recession, so it depends on whether the world can scrape up a few more mbd of oil to keep growth going without prices rising too much more. We will be watching oil production statistics closely…