
Remember the Sesame Street song?
One of these things is not like the others,
One of these things just doesn’t belong,
Can you tell which thing is not like the others
By the time I finish my song?
OK. Which curve on this chart is not like the others?

(click image to enlarge)
It’s the U.S. and Canada’s oil production curve over the past several years.
That’s why oil prices have fallen: too much oil for the demand in the world. The tight oil from North America is the prime suspect in the production surplus that’s pushing down oil prices.
Now that you know the answer, let’s talk about IEA’s January report that was released today. Here are my main takes from the report:
- The fourth quarter 2014 supply surplus was 890,000 barrels per day (see the chart below). That is the difference between supply and demand. We can argue about whether it was mainly supply or mainly demand-I’ve stated my belief that it’s mostly supply-but that’s the difference between them. That is why oil prices are falling.
- This surplus amount is 170,000 barrels per day greater than in the previous quarter.
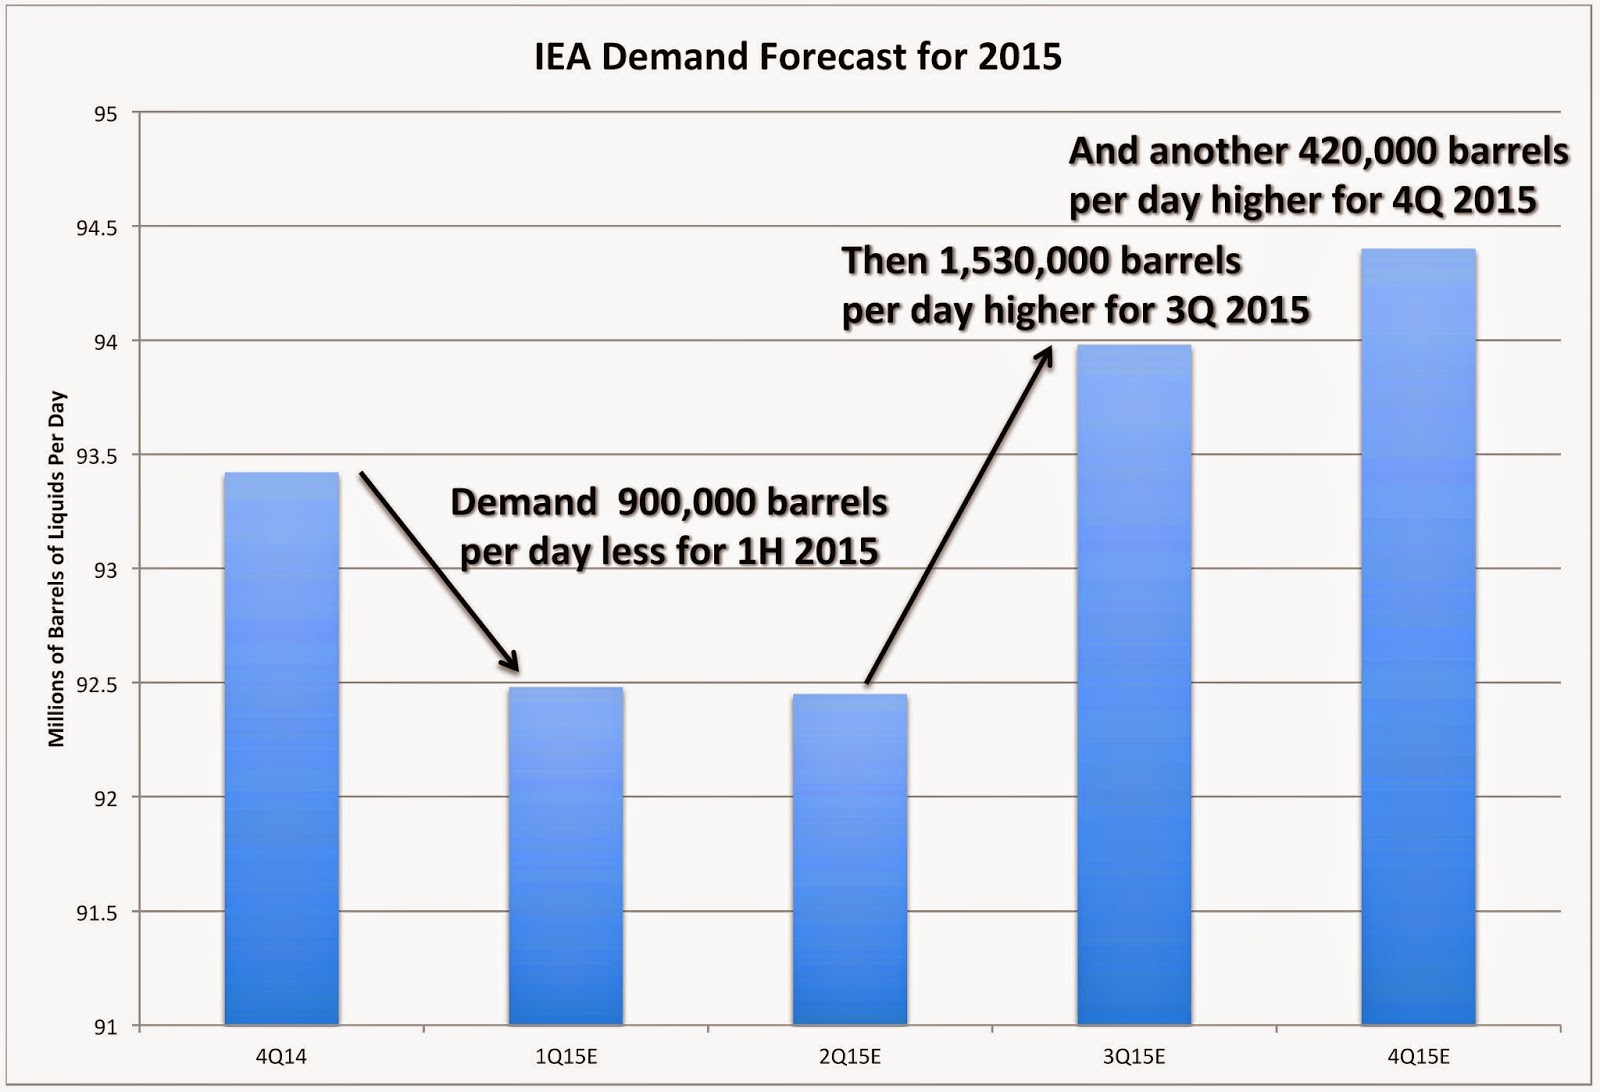
- Demand in the first half of 2015 will be 900,000 barrels per day lower than in the fourth quarter (see the second chart below). 1st half demand is usually lower than 2nd half but that means that prices could fall again.
- 3rd quarter 2015 demand will increase by 1,530,000 barrels per day and 4th quarter demand will increase another 420,000 barrels per day. That is a lot and would take demand to record highs. This should go a long way towards moving prices higher.

(click image to enlarge)
(click image to enlarge)
Now, these are only estimates and IEA is notoriously wrong in their forecasts but that’s what we have to work with. They don’t estimate production which is too bad but the report says that 2015 production is now revised down 350,000 barrels per day from previous estimates. IEA expects that most of that will happen in the 2nd half of 2015 after North American tight oil production starts falling.
So, where does that leave us? The problem is mostly about supply but demand has to increase if we’re going to fix the surplus problem in 2015 because supply is not expected to fall that much.
I think this means that prices will increase in 2015 but not a lot unless something else happens. That something else will probably be an OPEC and Russia production cut in June after the next OPEC meeting.
Remember, the supply surplus in the 4th quarter of 2014 was less than 1 million barrels per day. OPEC can easily accommodate this and has made bigger cuts as recently as 2009.
Some geopolitical crisis could also happen in the coming year and that might add $20/barrel or so. Negative things for a price increase could also happen like demand not growing as much as IEA forecasts or production not falling enough.
When do oil prices stop falling? No one knows and this data doesn’t have enough resolution much less reliability to help answer the question.
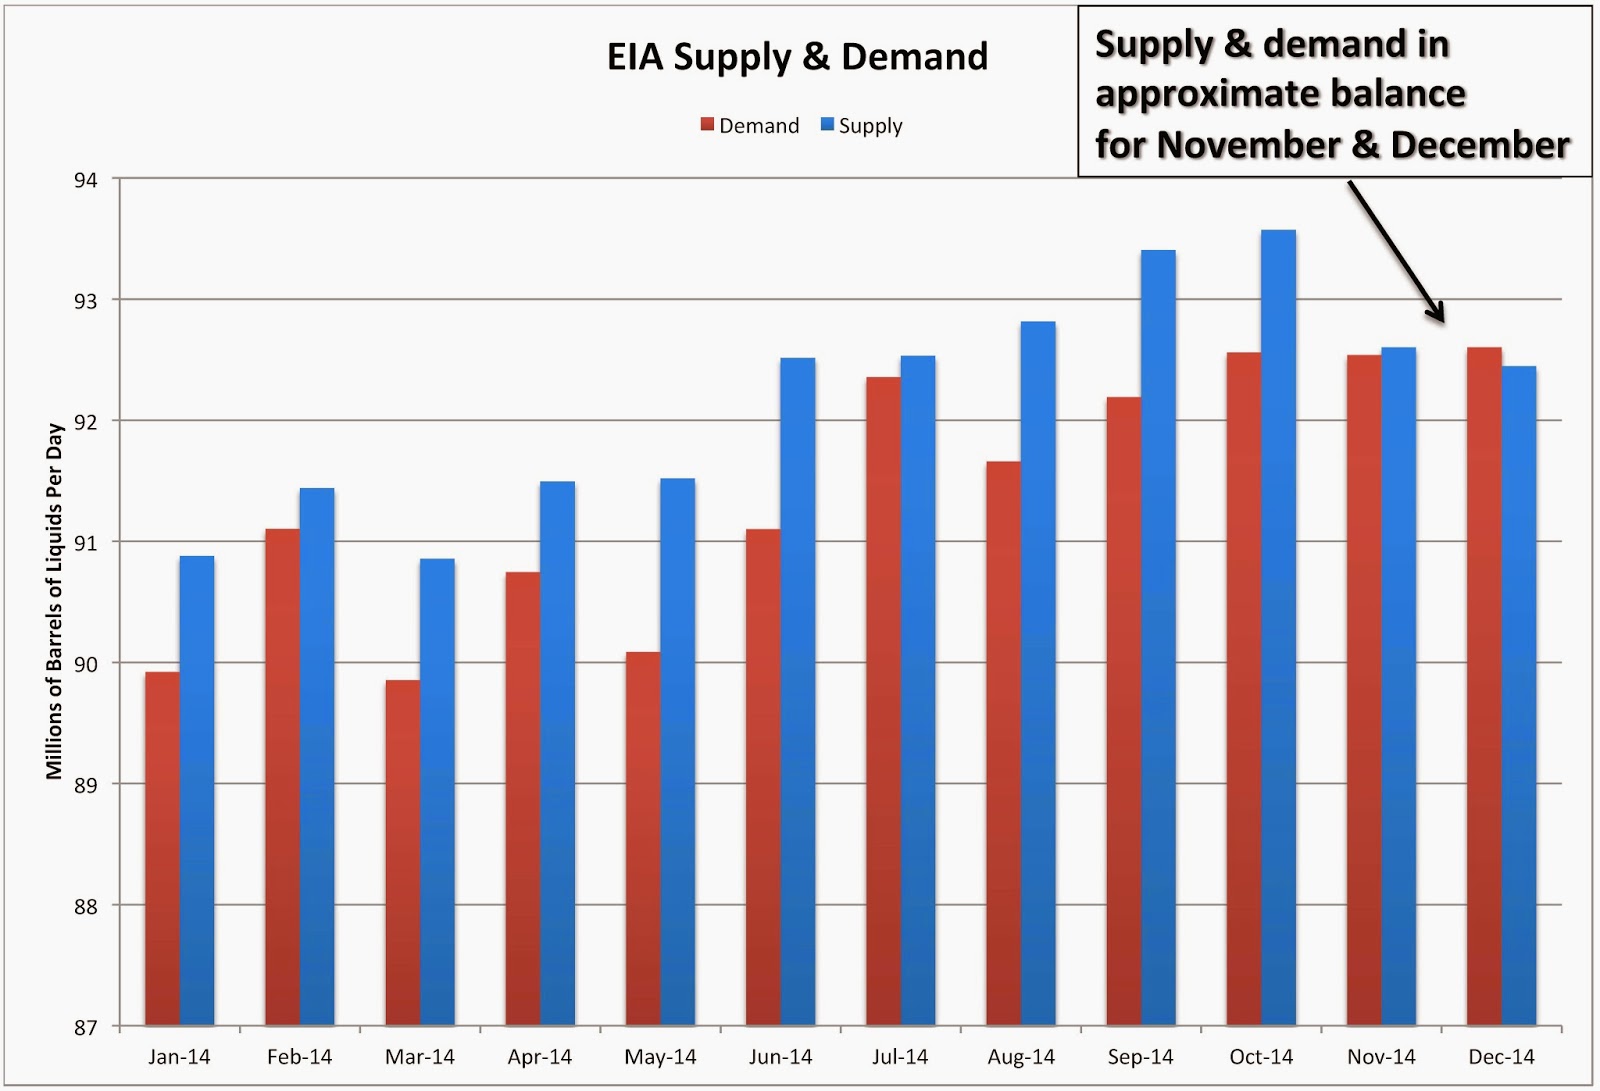
EIA, however, may offer some help here. EIA publishes monthly world data and, in the chart below, they show supply and demand in approximate balance for November and December of 2014.
(click image to enlarge)
That may signal that prices will find a bottom as soon as this balancing is felt by the market. Or not.


