On August 6, I wrote a post called Making Sense of the US Oil Story, in which I looked at US oil. In this post, I would like to look at other sources of US energy. Of course, the energy source we hear most about is natural gas. We continue to be a net natural gas importer, even as our own production rises.

Figure 1. US natural gas production and consumption, based on EIA data.
US natural gas production leveled off in 2013, because of the low level of US natural gas prices. In 2013, there was growth in gas production in Pennsylvania in the Marcellus, but many other states, including Texas, saw decreases in production. In early 2014, natural gas prices have been higher, so natural gas production is rising again, roughly at a 4% annual rate.
The US-Canada-Mexican natural gas system is more or less a closed system (at least until LNG exports come online in the next few years) so whatever natural gas is produced, is used. Because of this, natural gas prices rise or fall so that demand matches supply. Natural gas producers have found this pricing situation objectionable because natural gas prices tend to settle at a low level, relative to the cost of production. This is the reason for the big push for natural gas exports. The hope, from producers’ point of view, is that exports will push US natural gas prices higher, making more natural gas production economic.
The Coal / Natural Gas Switch
If natural gas is cheap and plentiful, it tends to switch with coal for electricity production. We can see this in electricity consumption–natural gas was particularly cheap in 2012:

Figure 2. Selected Fuels Share of US Electricity Production – Coal, Natural Gas, and the sum of Coal plus Natural Gas, based on EIA data.
Coal use increased further in early 2014, because of the cold winter and higher natural gas prices. In Figure 2, there is a slight downward trend in the sum of coal and natural gas’s share of electricity, as renewables add their (rather small) effect.
If we look at total consumption of coal and natural gas (Figure 3), we find it also tends to be quite stable. Increases in natural gas consumption more or less correspond to decreases in coal consumption. New natural gas power plants should be more efficient than old coal power plants in producing electricity, putting downward pressure on total coal plus natural gas consumption. Also, we are using more efficient lighting, refrigerators, and monitors for computers, holding down electricity usage, and thus both coal and gas usage. Better insulation is also helpful in reducing home heating needs (whether by electricity or natural gas).

Figure 3. Layered US consumption of coal and natural gas, based on EIA data.
Another factor in the lower electricity usage (and thus lower coal and natural gas usage) is fewer household formations since 2007. Young people who continue to live with their parents don’t add as much electricity usage as ones who set up their own households do. Low household formations are related to a lack of good-paying jobs.
Coal Production / Consumption
US coal production hit its maximum level in 1998, with production tending to decline since then. US coal consumption has been dropping faster than production, so that exports (difference between production and consumption) have been rising (Figure 4).

Figure 4. US coal production and consumption based on EIA data.
In 2012, about 16% of coal produced was exported. This percentage dropped to about 10% in 2013, with greater US coal usage.
Coal tends to cause pollution of several types, including higher carbon dioxide levels. It also tends to be less expensive that most other fuels, so world demand remains high. Worldwide, coal use continues to grow.
Nuclear and Hydroelectric
Hydroelectric is the original extender of fossil fuels. Hydroelectricity using concrete and metals became feasible in the 1800s, when we began using coal to provide the heat necessary to make metals and concrete in quantity. The first hydroelectric power plants were put in place in the US in the 1880s. As recently as 1940, hydroelectric provided 40% of the United States’ electrical generation.
Nuclear electric power was the next major extender of fossil fuels. The first nuclear power was added to the US energy mix in 1957, according to EIA data. The big ramp up in nuclear began in the 1970s and 1980s. Similar to hydroelectricity, nuclear requires fossil fuels to build and maintain its plants making electricity.
If we look at the US distribution of fuels, we see that in recent years, nuclear has been a much bigger source of energy than hydroelectricity.

Figure 5. US Energy Consumption, showing the various fossil fuel extenders separately from fossil fuels, based on BP data.
The above comparison includes all types of energy, not just electricity. The grouping GeoBiomass is a BP grouping including geothermal and various forms of wood and other biomass energy, including sources such as landfill gas and other energy from waste. Note that GeoBiomass, Biofuels, and Solar+Wind are hard to see on Figure 5, because of their small quantities.
If we look at hydro and nuclear separately for recent years (Figure 6, below), we see that nuclear has tended to grow, while hydro has tended to fall, although both now seem to be on close to a plateau. Hydro tends to be more variable than nuclear because it depends on rainfall and snow pack, things that vary from year to year and month to month.

Figure 6. Comparison of US nuclear and hydroelectric consumption, based on EIA data.
The reason why hydro has tended to decrease in quantity over time is that it takes maintenance (using fossil fuels) to keep the aging power plants in operation and silt removed from near the dams. Most of the good locations for dams are already taken, so not much new capacity has been added.
Nuclear power plant electricity production has grown even since the 1986 Chernobyl accident because the United States has continued to expand the capacity of existing nuclear facilities. I do not expect this trend to continue, for a variety of reasons. Not all such capacity expansions have worked out well. The capacity expansion of the San Onofre plant in California in 2010 experienced premature wear and is now being decommissioned. Many of the nuclear plants built in the 1970s are reaching the ends of their useful lives. Unless we add a large number of new nuclear plants in the next few years, it seems likely that US generation of nuclear electricity will be falling over the next 20 years.
Other Energy Types
It is easier to see other energy types if we look at them as a percentage of US total energy consumption. The following is a graph of “renewables” as a percentage of US energy consumption, using EIA data:
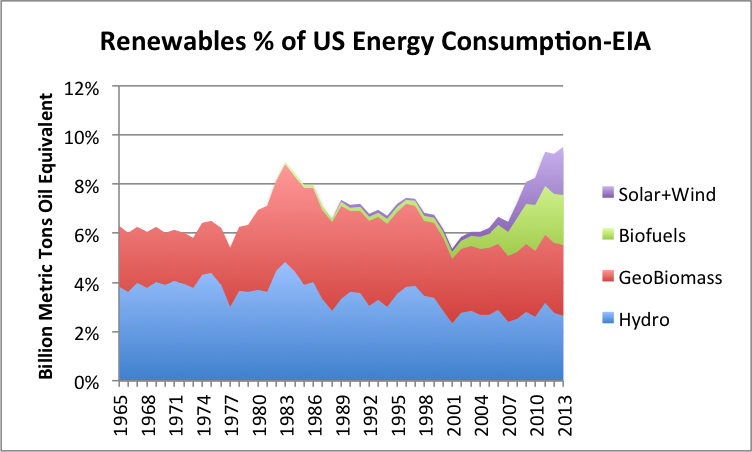
Figure 7. Renewables are percentage of US energy consumption, using EIA data (but groupings used by BP).
A person can see that over the long haul, hydroelectric has tended to shrink as a percentage of energy consumption, as energy needs grew and hydroelectric failed to keep up.
The GeoBiomass category is BP’s catch-all category, mentioned above.1 It (theoretically) includes everything from the wood we burn in our fireplaces to the charcoal briquettes we use to cook food outdoors, to home heating with wood or briquettes to the burning of sawdust or wood pieces in power plants. It also includes geothermal, which is about 6% as large as hydroelectric, and is increasing gradually over time. Based on EIA data, biomass isn’t growing either in absolute amount or as a percentage of total energy consumed.
Biofuels are liquid fuels made from biomass used to extend oil consumption. In the US, the major biofuel is ethanol, made from corn. It is used to extend gasoline, generally up to 10%. A chart of production and consumption shows that US biofuel production “topped out,” once it hit the 10% of gasoline “blendwall”.

Figure 8. US biofuel production and consumption, based on EIA data.
Biofuels now amount to 5.7% of US petroleum (crude oil plus natural gas liquids) consumption. In recent years, the US is a slight exporter of biofuels.
Corn ethanol currently takes about 40% of US corn production, according to the USDA (Figure 9). Greater corn plantings would put pressure on land usage for other crops.

Figure 9. USDA corn use, from USDA site.
If someone figures out how to make cellulosic ethanol cheaply (perhaps from wood), it presumably will cut into the market for corn ethanol, unless the blend wall is raised to 15%. Without additional ethanol coming from a source such as cellulosic ethanol, such an increase in the maximum blending percentage would likely be problematic.
Wind and Solar PV
Wind and Solar PV are sources of US electricity, so really need to be compared in that context. If we compare nuclear, hydroelectric, and all renewable electricity other than hydro (including electricity from wood, sawdust, and waste, and from geothermal, in addition to wind and solar) we see that in total, all other renewables are approximately equal to hydro electricity in quantity:

Figure 10: Hydroelectric, other renewables, and nuclear as a percentage of US electricity supply, based on EIA data.
If we look at the pieces of other renewables separately, we see the following:
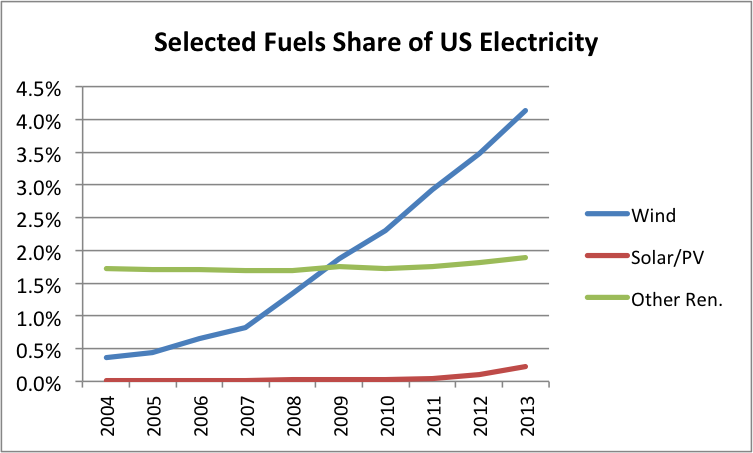
Figure 11. Wind, solar/PV and other renewables as a percentage of US electricity, based on EIA data.
Wind energy has indeed grown in quantity. Solar/PV is growing, but from a very small base. The remainder, which includes geothermal, wood and various waste products, is growing a bit.
A major issue with wind and solar is that we badly need a “solution” to our energy problem, so these are “pushed,” whether they are really helpful or not. Some issues involved:
(a) Cost effectiveness. Studies (such as by Brookings Institution, Weissbach et al., Graham Palmer) show that wind and solar PV are not cost-effective for reducing carbon emissions. If we want to reduce carbon emissions, conservation or switching from coal to natural gas would be more cost effective.
(b) Peak supply or peak affordability (demand in economists’ language)? The peak oil “story” often seems to be that because of inadequate supply, oil and other fossil fuel prices will rise, and substitutes will suddenly become competitive. This story is used to support a switch to wind and solar PV and high priced biofuels, since the expected high prices of fossil fuels will supposedly support the high cost of renewables.
Unfortunately, the story is wrong. High prices of any fuel tend to lead to recession because wages don’t rise to match the high prices. Also, a country using the high-priced fuel tends to become less competitive compared to countries that don’t use the high-priced fuel. The net effect is that prices don’t rise very much. Instead, manufacturing moves to countries that use less-expensive fuels. Oil prices may fall so low (relative to the cost of oil production) that oil producers sell their land and increase dividends to shareholders instead; in fact, this seems to be happening already.
(c) Hoped for long-term life. If fossil fuels have problems, can “renewables” have long life-spans in spite of those problems? Not that I can see. It takes fossil fuels to maintain the electric grid and to produce any modern renewable, such as wind, or solar PV or wave energy. Wind turbines need frequent replacement of parts, and solar PV needs new “inverters.” Wood and biomass will have long lives, if not overused, but these won’t keep the electric grid operating.
(d) Apples to oranges cost comparisons. There are a few situations where wind and solar PV are used to substitute for oil–for example, on islands, where oil is used to operate electricity generation. In these cases, wind and solar PV are likely already competitive, without subsidies. In these situations, per capita use of electricity can be expected to be very low, because exports made with such high-priced electricity will be non-competitive in the world market-place.
The confusion comes elsewhere, where substitution is for natural gas, coal, or nuclear energy. Here, the savings to an electric company is primarily a savings in fuel cost, that is, the cost of the natural gas, or coal or uranium. The plant’s manpower needs and its cost of electric grid maintenance will be the same (or higher). There may be costs associated with monitoring the new sources of electricity added to the grid or additional balancing costs, and these need to be considered as well.
If we want to maintain the electric grid so we can continue to have electricity for a variety of purposes, the “correct” credit for intermittent renewables is the savings to the power companies–which is likely to be close to the savings in fuel costs, or about 3 cents per kWh on the mainland United States. This is far less than the “net metering” benefit (offering a benefit equal to the retail cost of electricity) that is often used for grid-tied solar PV. It is also generally less than the “wholesale time of day” cost of electricity, often used for wind.
Germany is known for its encouragement of wind and solar PV, using liberal funding for the renewables. This approach has adverse ramifications, including high electricity costs, less grid stability, closure of some traditional natural gas power plants, and rising carbon dioxide emissions. A recent article called Germany’s Electricity Market Out of Balance by the Institute for Energy Research summarizes these issues.
Summary
It would be great if we had a solution for our non-oil energy issues, but we really don’t. The closest we can perhaps come is scaling up natural gas consumption some, and reducing coal’s current portion of the electricity mix. We currently have a large amount of coal consumption relative to natural gas consumption (Figure 3), so we ourselves have good use for rising natural gas production, if it should actually take place.
The “catch” in scaling up natural gas consumption is a price “catch.” If the price of natural gas price rises too high relative to coal, then electricity production starts switching back to coal. If, on the other hand, natural gas prices don’t rise very much, not much of an increase in production is likely to be available. Producers would like to export (a lot of) natural gas to Europe, as a way of jacking-up US natural gas prices. This seems like a pipe dream. See my article The Absurdity of US Natural Gas Exports.
Nuclear is a big question mark. If the United States starts taking much nuclear off line, it will leave a big hole in electricity generation, especially in the Eastern part of the US. Germany and recently Belgium are starting to experience the effect of taking nuclear off line. It is hard to see how wind and solar PV can play a very big role in offsetting the nuclear loss.
Politicians need to have a “solution” they can call an energy savior, but it is hard to see that renewables will play more than a small role. Biofuels seem to have “topped out” for now. Wind and solar PV are still growing, but it is hard to justify subsidies for them, as part of the electric grid system. Solar PV does have uses off grid, if citizens want their own source of electricity, with their own inverters and back-up batteries. There are also business uses of this type–for example, to operate equipment in a remote location.
I have not tried to cover all of the various smaller items. There may also be growth possibilities for items that I have not discussed, such as solar thermal for heating hot water, particularly in warm parts of the United States.
Note:
[1] I have used BP’s GeoBiomass grouping for convenience, but I am adding together EIA data amounts. What is included in the “biomass” portion of GeoBiomass seems to vary from agency to agency (BP, EIA, IEA), because of different definitions of what is included. For example, is animal dung burned as fuel included? Is fuel that is gathered by a family, rather than purchased, included? I am using EIA data for US renewables in Figure 7, since its long-term data series is probably as good as any for the US.
Power plant teaser image via shutterstock. Reproduced at Resilience.org with permission.