NOTE: Images in this archived article have been removed.
A translation of the IPCC 5th Assessment Report Summary for Policymakers
WHO: The Intergovernmental Panel on Climate Change
WHAT: Summary for policy makers of their 2000 page 5th Assessment Report (AR5) of the state of the climate and climate science.
WHEN: 27 September 2013
WHERE: On the IPCC website
TITLE: Climate Change 2013: The Physical Science Basis Summary for Policymakers(open access)
There’s a lot of things not to like about the way the IPCC communicates what they do, but for me the main one is that they speak a very specific dialect of bureaucrat that no-one else understands unless they’ve also worked on UN things and speak the same sort of acronym.
The worst bit of this dialect of bureaucrat is the words they use to describe how confident they are that their findings are correct. They probably believe they’re being really clear, however they use language that none of the rest of us would ever use and it means their findings make little sense without their ‘very likely = 90-100% certain’ footnote at the front.
So now that we’ve established that the UN doesn’t speak an understandable form of English, what does the report actually say? It works its way through each of the different climate systems and how they’re changing because humans are burning fossil fuels.
As you can see from this lovely graph, each of the last three decades has been noticeably warmer than the proceeding one, and the IPCC are 66% sure that 1983-2012 was the warmest 30 year period in 1,400 years.
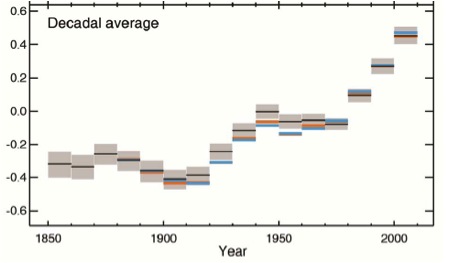
Decade by decade average temperatures (Y axis is change in Celsius from base year of 1950) (from paper)
One of the reasons I really like this graph is you can see how the rate of change is speeding up (one of the key dangers with climate change). From 1850 through to around 1980 each decade’s average is touching the box of the average before it, until after the 80s when the heat shoots up much more rapidly.
The report did have this dig for the deniers though: ‘Due to natural variability, trends based on short records are very sensitive to the beginning and end dates and do not in general reflect long-term climate trends’. Which is UN bureaucrat for ‘when you cherry pick data to fit your denier talking points you’re doing it wrong’.
Looking at regional atmospheric trends, the report notes that while things like the Medieval Warm Period did have multi-decadal periods of change, these changes didn’t happen across the whole globe like the warming currently being measured.
In the oceans, the top layer has warmed (the top 75m) by 0.11oC per decade from 1971 to 2010, and more than 60% of the carbon energy we’ve pumped into the atmosphere since 1971 has been stored in the top layer, with another 30% being stored in the ocean below 700m.
This extra heat is not just causing thermal expansion, it’s speeding up sea level rise, which the IPCC are 90% certain increased from 1901 to 2010 from 1.7mm per year to 3.2mm per year. This is now happening faster than the past two millenniums. Yes, sea level is rising faster than it has for the last 2,000,000 years so you might want to sell your waterfront property sooner, rather than later.
The extra carbon has also made it harder to live in the ocean if you own a shell, because the acidity of the ocean has increased by 26% which makes shells thinner and harder to grow.
On the glaciers and the ice sheets, the IPCC is 90% certain that the rate of melting from Greenland has increased from 34Gigatonnes (Gt) of ice per year to 215Gt of ice after 2002. Yes, increased from 34Gt to 215Gt – it’s melting six times faster now thanks to us.
For Antarctica, the IPCC is 66% certain that the rate of ice loss has increased from 30Gt per year to 147Gt per year, with most of that loss coming from the Northern Peninsula and West Antarctica. Worryingly, this ice loss will also include the parts of Antarctica that are gaining ice due to natural variability.
And at the North Pole, Santa is going to have to buy himself and his elves some boats or floating pontoons soon, because the IPCC have found ‘multiple lines of evidence support[ing] very substantial Artctic warming since the mid-20th Century’. Sorry Santa!
As for the carbon we’ve been spewing into the atmosphere since the 1850s, well, we’re winning that race too! ‘The atmospheric concentrations of carbon dioxide, methane and nitrous oxide have increased to levels unprecedented in at least the last 800,000 years’.Congratulations humanity – in the last century and a half, we’ve changed the composition of the atmosphere so rapidly that this hasn’t been seen in 800,000 years!
Methane levels have gone up by 150%, and I’m undecided as to whether that means I should eat more beef to stop the cows from farting, or if it means we raised too many cows to be steaks in the first place…
This is the part of the report where we get into the one excellent thing the IPCC did this time around – our carbon budget. I’m not sure whether they realised that committing to reduce certain percentages by certain years from different baselines meant that governments were able to shuffle the numbers to do nothing and make themselves look good at the same time, but this is a promising step.
I’ve written about the very excellent work of Kevin Anderson at the Tyndall Centre in the UK before, but the basic deal with a carbon budget is this: it doesn’t matter when we burn the carbon or how fast, all the matters is the total emissions in the end. You can eat half the chocolate bar now, and half the chocolate bar later, but you’re still eating a whole bar.
Our budget to have a 2/3 chance of not going beyond dangerous climate change is 1,000Gt of carbon and so far we’ve burnt 545Gt, so we’re more than halfway there. All of this leads to the conclusion that ‘human influence on the climate system is clear. This is evident from the increasing greenhouse gas concentrations in the atmosphere, positive radiative forcing, observed warming and understanding of the climate system.’
What observations you may ask? Scientists have made progress on working out how climate change pumps extreme weather up and makes it worse. They also got it right for the frequency of extreme warm and cold days, which if you live in North America was the hot extremes winning 10:1 over the cold extremes. Round of applause for science everyone!
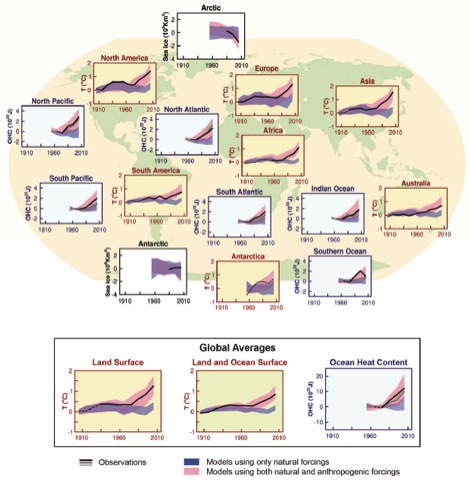
Warming with natural forcing vs human forcing and how it lines up with the observations (from paper)
They’re also 95% sure that more than half of the observed global surface warming from 1951 is from humanity. So next time there’s a nasty heatwave that’s more frequent than it should be, blame humans.
The report does also point out though that even though the heat records are beating the cold records 10-1, this doesn’t mean that snow disproves climate change (sorry Fox News!). There will still be yearly and decade by decade by variability in how our planet cooks which will not be the same across the whole planet. Which sounds to me like we’re being warmed in an uneven microwave. For instance, El Niño and La Niña will still be big influencers over the Pacific and will determine to a great extent the variability in the Pacific North West (yeah, it’s still going to rain a lot Vancouver).
For those that were fans of the film The Day After Tomorrow, there’s a 66% chance the Atlantic Meridional Circulation will slow down, but only a 10% chance it will undergo an abrupt change or collapse like it did in the film, so you’re not going to be running away from a flash freezing ocean any time this century.
The report then runs through the different scenarios they’ve decided to model that range from ‘we did a lot to reduce carbon emissions’ to ‘we did nothing to reduce carbon emissions and burned all the fossil fuels’. Because this is the IPCC and they had to get EVERYONE to agree on each line of the report (I’m serious, they approved it line by line, which has to be the most painful process I can think of) the scenarios are conservative in their estimations, not measuring tipping points (which are really hard to incorporate anyway). So their ‘worst case scenario’ is only 4.0oC of surface warming by 2100.
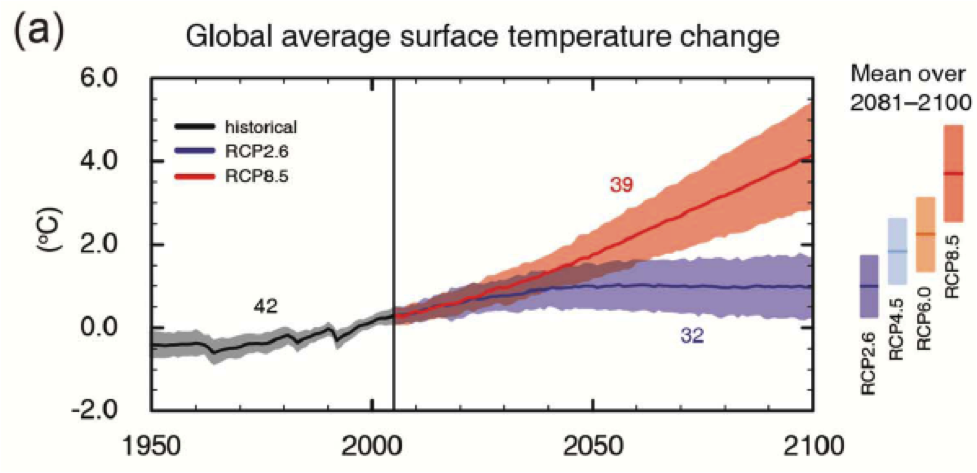
Representative Concentration Pathway (RCP) Scenarios from the IPCC AR5
Now, obviously ‘only’ 4oC of climate change by the end of the century is still prettyunbearable. There will still be a lot of hardship, drought, famine, refugee migration and uninhabitable parts of the planet with 4oC. However, once we get to 4oC, it’s likely to have triggered tipping points like methane release from permafrost, so 4oC would be a stopping point towards 6oC even if we ran out of carbon to burn. And 6oC of course, as you all hear me say frequently is mass extinction time. It’s also the point at which even if humanity did survive, you wouldn’t want to live here anymore.
The paper finishes up with a subtle dig at the insanity of relying on geoengineering, pointing out that trying to put shade reflectors into orbit or artificially suck carbon out of the air has a high chance of going horribly wrong. They also point out that if we did manage large scale geoegineering and it then broke down, re-releasing that carbon back into the atmosphere would super-cook the planet really quickly.
The moral of this 36 page ‘summary’ is that it’s us guys. We’re as certain that we’ve done this as we are that smoking causes cancer. We have burned this carbon and it’s changed the chemical energy balance of the atmosphere and if we don’t stop burning carbon we’re going to cook the whole planet. Seriously. So let’s finally, actually stop burning carbon.
Smoking image via Vaikunda Raja/wikimedia