
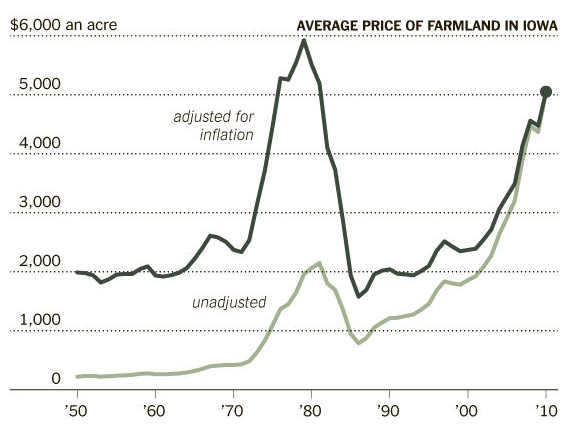
The New York Times has a very useful article this morning on booming prices for agricultural land. There’s lots of nice human color in the story, but the graphic above is the heart of it. It shows average prices of Iowa farmland – focus on the black line which is adjusted for inflation. Obviously, things are increasing rapidly, and approaching the 1970s peak in real terms.
I note the similar timing of this latest boom (really taking off a little after 2000) with this picture from the other day:
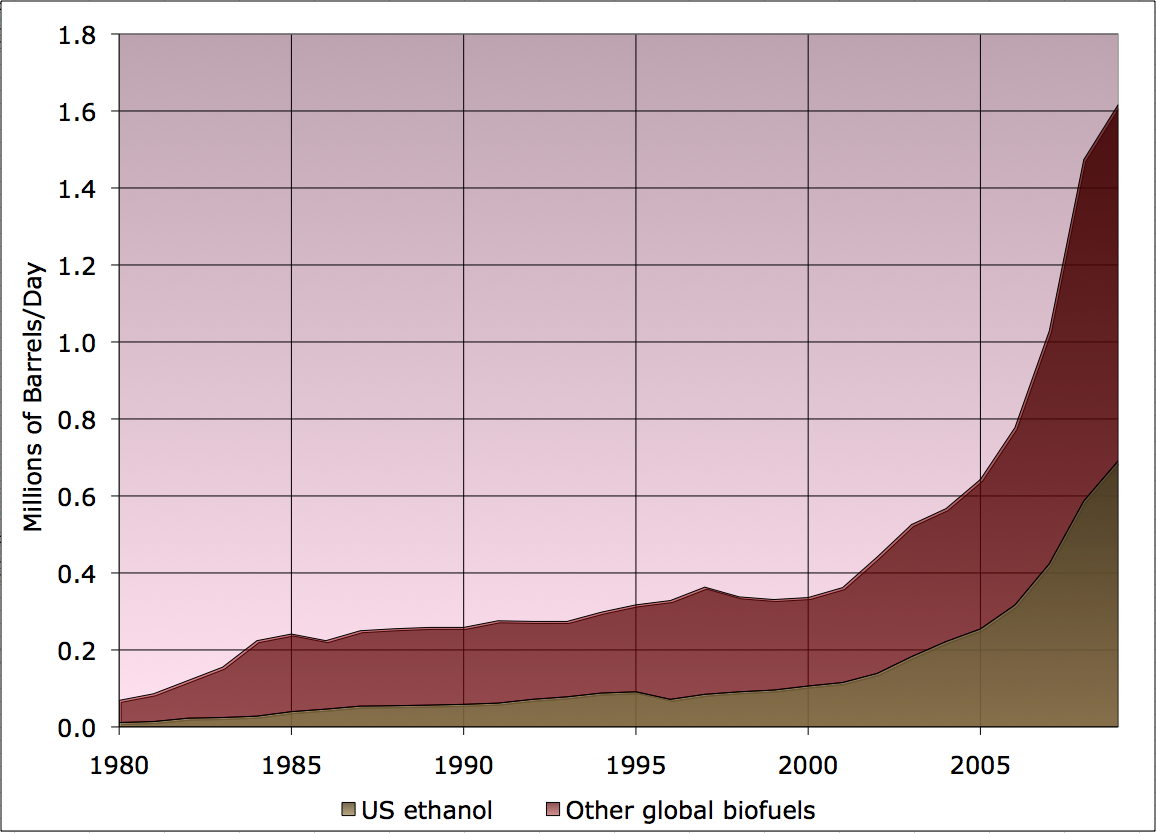
Correlation doesn’t prove causation, of course, but certainly the timing is right. To move toward a better sense of how much of the food price boom we can attribute to biofuels, let’s try to examine on a global basis how much of the food supply is being diverted to fuel.
Firstly, let’s acknowledge that this exercise is fraught with complexities:
- The human diet involves foods taken from various trophic levels. We eat corn and soybeans directly, but we also eat cows and pigs that ate corn and soybeans, and converted a small fraction of the crops into the flesh we consume. When a certain amount of corn is diverted into making fuel, do we compare against the corn we could have eaten, or the cows we could have eaten, after they’d eaten the corn?
- To the extent biofuels have been increasing food prices, this will have caused farmers to expand land in cultivation, invest in capital improvements that increase their yields, etc, etc. So it’s not as simple as all crops being used for biofuels are taken away from food: the crop supply will undergo a supply increase also.
Firstly, here’s the per-capita food supplies from the FAO:

As the world has gotten wealthier over the last 50 years, on average people have eaten better (well, more, anyway), but they’ve taken a smaller fraction of their nutrition in the form of cereals directly.
If we multiply this out by UN population estimates, we get this for the total:
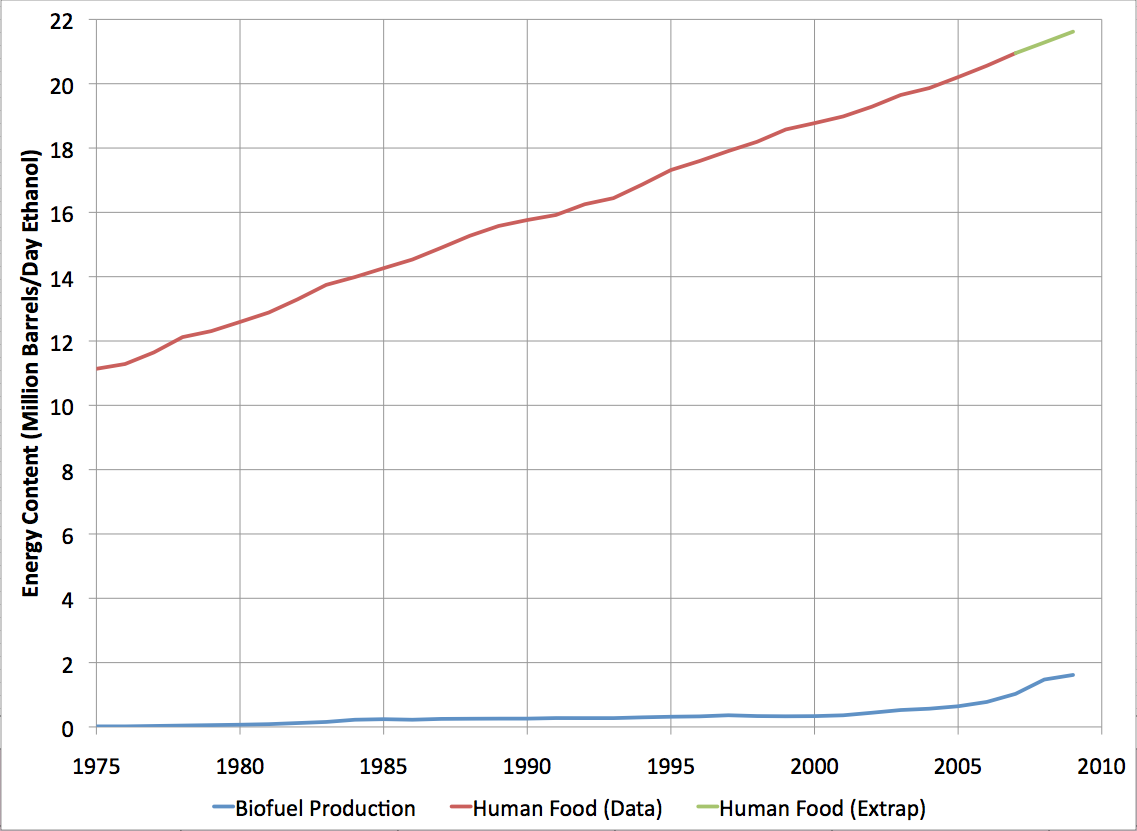
Here, I’ve expressed the food based on the equivalent energy in ethanol. I’ve also extrapolated the food to cover the years 2008 and 2009 (based on the prior decades growth rate), and I’ve shown (blue line) the actual biofuel production for the world.
It’s worth noting that the energy content of the human food supply is about a sixth of the energy content of the human fuel supply (about 86 mbd of liquid fuels, equivalent to somewhere in the neighborhood of 120-130mbd of ethanol). This is the core problem with converting food to fuel – we are taking from a small pool to try to make up for deficiencies in a large pool, and we will have a much bigger effect on the level of the small pool than the bigger pool.
Finally, here is the ratio of energy being delivered as biofuel to energy being delivered as food:
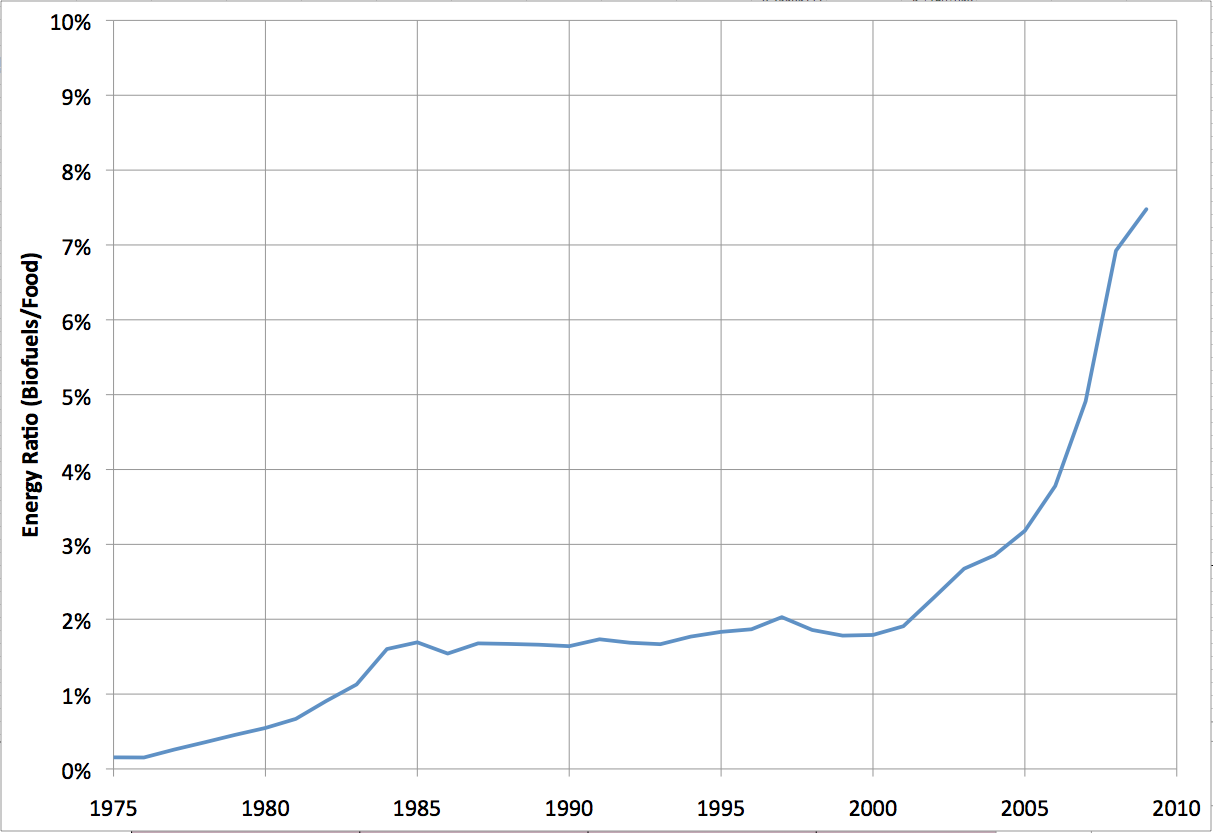
So globally, biofuels are up to the point where they deliver about 8% of the amount of energy being delivered in the form of human food. A fuller analysis will have to await another day, but I think it should be clear that, given inelastic demand for food (food is a necessity), this would cause significant price changes.