
In this post I briefly present the results from my analysis of absolute and relative trends in world oil (all liquids) supply, consumption, net exports and net imports between 1980 and 2009. In this analysis the world has been split into 5 economic groups, OECD (30 developed countries), OPEC (current 12 countries), FSU (Former Soviet Union; 15 countries), China and India and ROW (Rest Of World).
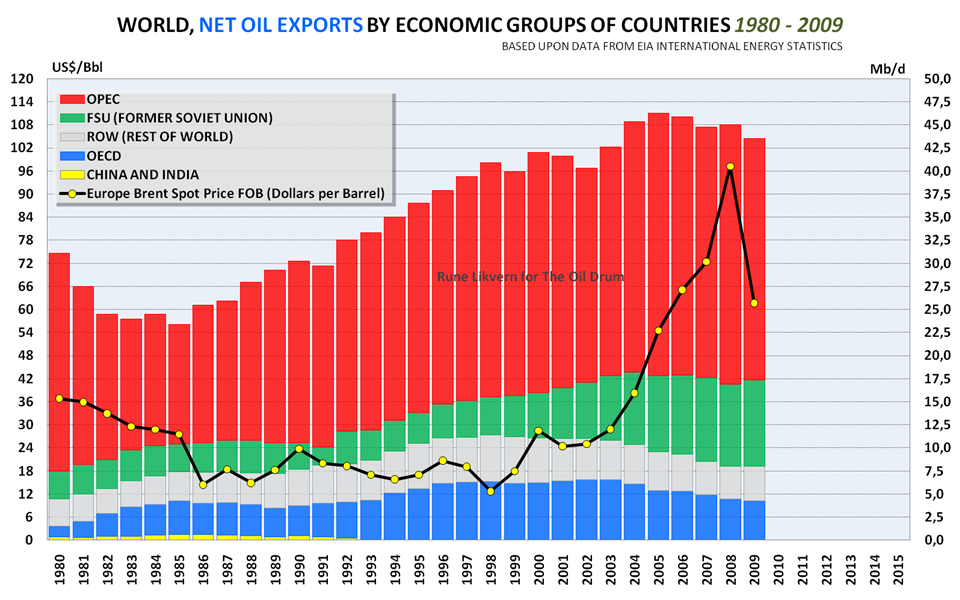
The stacked columns show development in net exports of all liquid energy split among OPEC, FSU (Former Soviet Union), ROW (Rest Of World), OECD and China+India from 1980 to 2009. The development in the annual oil price is plotted against the left hand y-axis.
My analysis very much supports the view that fundamentals (demand/supply balance) were the cause for the increase in the oil price in the 2002 to 2008 period. It appears to me that the continuation of economic growth during 2004 – 2008 also coincided with declining OECD oil supply, leading to strong growth in the oil price.
I also present some observations about what is different now compared to the recovery following the recession of the 80s. At that time, oil prices were very much declining due to growth in OECD oil supply from Alaska, the North Sea and Mexico. At this point, we are seeing rising prices compared to a year ago, related at least in part to the impact of stimulus programs.
It appears to me that between now and the end of 2011, we may see available supplies stretched increasingly tightly, provided that “the wheels stay on the world economy”. This is similar to my conclusion from a recent post, OPEC’s Spare Crude Oil Capacity – Will it Disappear by the End of 2011?
DISCLAIMER: The author holds no positions in the oil/energy market that may be affected by the content of this post.
NOTE: Diagrams based upon EIA data that may be subject to future revisions.
Both EIA’s Short Term Energy Outlook and IEA’s Oil Market Report agree that near term world demand for liquid energy will grow. As we now move into winter in the Northern hemisphere (a time when oil demand normally increases) movement in oil price will become a good indicator of the world’s oil supply/demand balance. Since energy data are not published until months or years after the fact, oil price movements also serve as an indicator for the general direction of the world economy.
World Oil Supply and Net Oil Exports
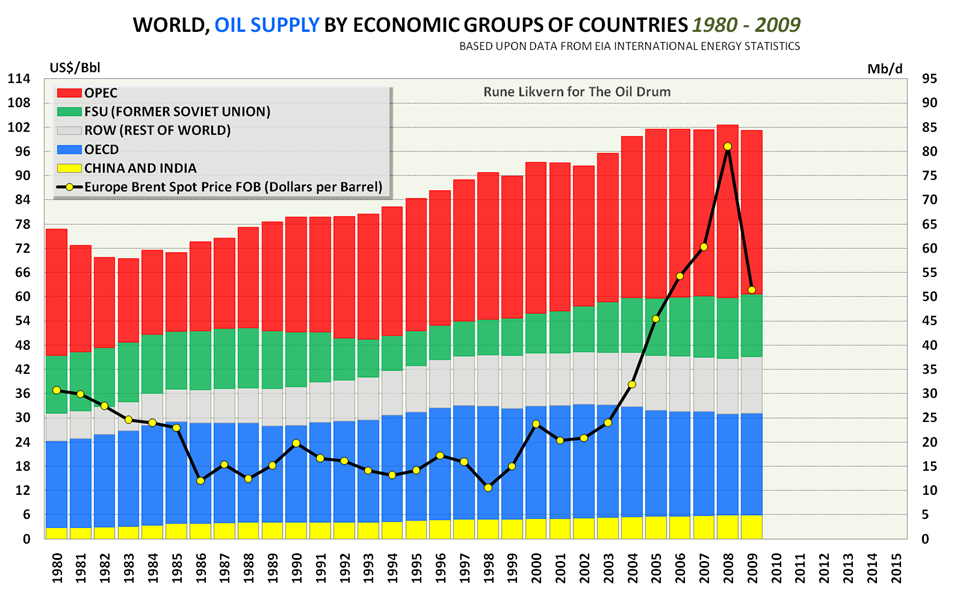
Figure 01: The stacked columns in the diagram above show the development in world supplies of liquid energy (crude oil, condensates, NGLs and other liquid energy) from 1980 to 2009, split among 5 economic groups of countries. Annual oil price (Brent) is plotted against the left hand y-axis.
The chart above illustrates how world oil supply grew steadily for over 20 years, between 1983 (after the oil price shock and the recession in the early 80s) and 2005. After 2005, it formed a plateau. Apparently, the growing oil supply from some OECD countries (ref also figures 03 and 05) helped bringing down the oil price and contributed to 2 decades of low and predictable oil price.
The chart also shows how recent (1997 to present) growth in oil supply from FSU supported Non OPEC growth in oil supplies and its effect on maintaining the recent plateau in world oil supply (ref also figure 06).
The remarkable thing is that by coincidence the oil price started its strong growth as OECD supply started to decline during 2004.
During the first half of 2010, the average oil price was $77/Bbl (Brent) which is approximately 25 % above the annual price of $62/Bbl in 2009. This has increased world supply by 1,6 Mb/d (1,1 Mb/d (C+C), 0,3 Mb/d (NGLs), 0,2 Mb/d (other liquid energy)) so far in 2010 relative to 2009. A major part of the growth in supply is growth in net oil exports.
In the past year, many of the OECD countries have applied stimulus packages. It appears that the result of this additional spending has been higher oil prices, without much additional oil supply. Furthermore, EIA and IEA forecasts now both indicate that OECD oil supply is headed for a near term decline.
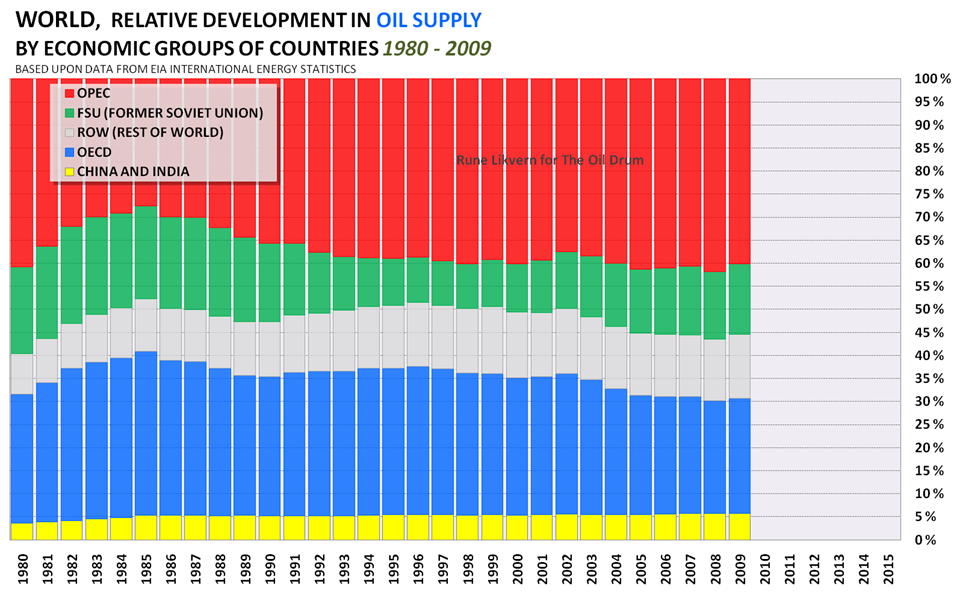
Figure 02: The stacked columns in the diagram above show relative development in world oil (all liquids) supply among the 5 economic groups of countries presented here.
Figure 02 illustrates how OPEC’s share of world supply declined between 1980 and 1985. Since then, it has grown to approximately 40 % now. The chart also shows how OECD’s share is now declining.
The world oil supply picture tells only part of the story. What is equally important is to understand developments in world net oil exports.
Figure 03: The stacked columns in the diagram above show development in world net oil exports of liquid energy (crude oil, condensates, NGLs and other liquid energy) from 1980 to 2009, split among the 5 economic groups of countries. The development in the annual oil price (Brent) is plotted against the left hand y-axis. NOTE: net oil exports are calculated as the difference between production and consumption for the exporters. Adjustments for stock changes may impact the annual numbers a little in either direction.
The diagram shows that world net oil exports reached a high in 2005, and have since declined. There was a larger decline 2009, mainly due to reduced oil imports into OECD caused by the economic slowdown. The growth in oil price after 2005 did not result in an increase in world net oil exports, which strongly suggests that price rationing took place.
In 2009 there were 31 countries that had annual net exports above 100 kb/d. Some of these, including Brazil, Colombia, and Sudan, are included in the ROW group.
It appears that growth in the oil price coincided with the start of decline in OECD net exports in 2004.
The chart also illustrates that growth in net oil exports in recent years have come from FSU and OPEC. More about this following Figure 07.
World net oil exports could reach another high in the near future. For the first half of 2010, world oil supply grew by 1,6 Mb/d relative to 2009 in response to a 25 % growth in the oil price. Most of this supply growth is believed to be increased net exports. In the post OPEC’s Spare Crude Oil Capacity – Will it Disappear by the End of 2011? I analyzed how OPEC oil supplies in recent years had responded to the oil price as an approach to identifying what probable spare marketable crude oil capacity OPEC has. In the linked post, I found it probable that present marketable crude oil spare capacity within OPEC is around 2 Mb/d. There are estimates from EIA and IEA showing higher spare capacity within OPEC, while some informed analysts believe it is lower.
The bottom line here is that there exists possibilities that new highs of both world oil supplies and net oil exports could happen in 2010 or 2011. What happens beyond 2011 is anyone’s guess–I expect that both total world oil supplies and net exports will show declines in 2012 at the latest.
Figure 03 also demonstrates how net oil exports from FSU have grown in recent years. World supplies, net exports and the world economy would have been quite different without FSU’s growth in supplies.
NOTE! It may appear strange to some readers that OECD in Figure 03 is shown as a net exporter. Some OECD countries are or have been net exporters of oil, ref also figure 5. Estimates for net imports into OECD have been done assuming that oil produced within OECD stays within OECD. Thus what is presented for OECD in Figure 09 is net imports for OECD from sources outside OECD.
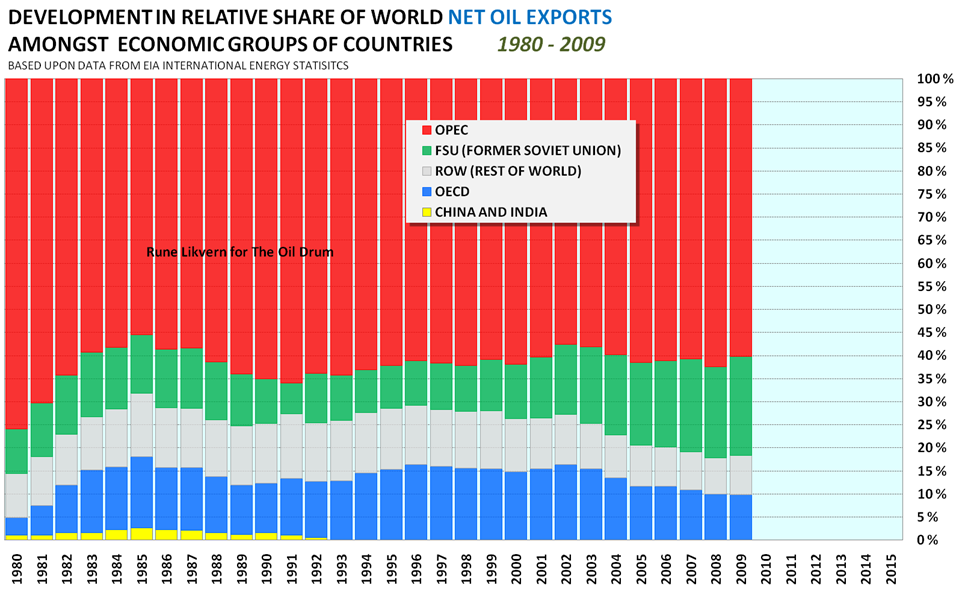
Figure 04: The stacked columns in the diagram above show relative development in world net oil (all liquids) exports among the 5 economic groups of countries presented here.
The chart shows how OPEC’s share of net oil exports declined from around 76 % to around 55 % during the first half or the 80’s. As of 2009 OPEC had around 60 % of world’s net oil exports and FSU had grown their share to around 22 %. I currently expect that both OPEC’s and FSU’s share of future world net oil exports to grow.
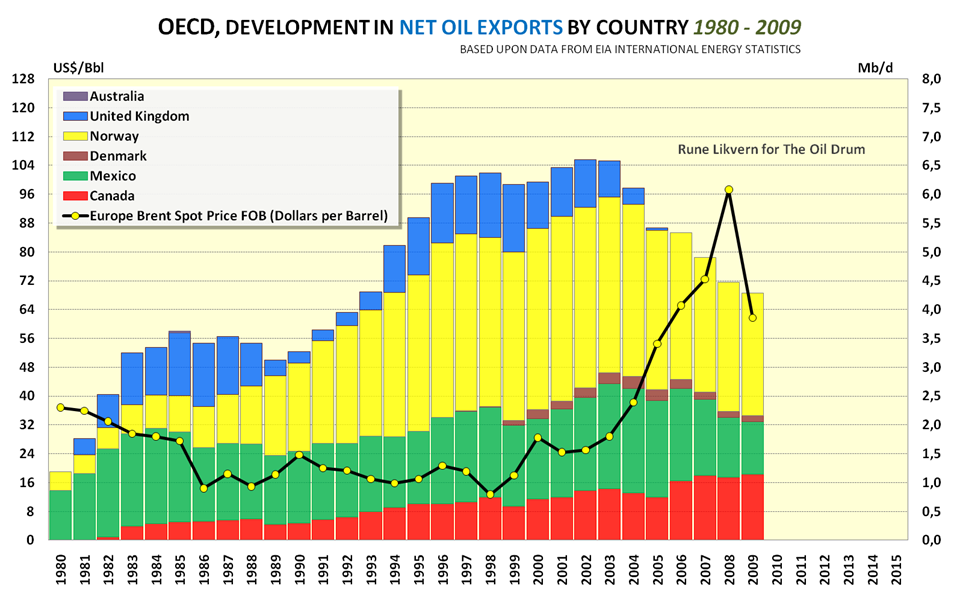
Figure 05: The stacked columns in the diagram above show development in OECD net oil exports of liquid energy (crude oil, condensates, NGLs and other liquid energy) from 1980 to 2009. The development in the annual oil price (Brent) is plotted against the left hand y-axis.
What I found interesting in the chart above is that it shows how the oil price declined during the first half of the 80s with growth in OECD oil supply and net oil exports, and then remained stable and predictable until net exports from OECD started its decline in 2004. The decline in OECD net exports continues in 2010, and the oil price so far in 2010 is up 25 % relative to 2009 on an annual basis.
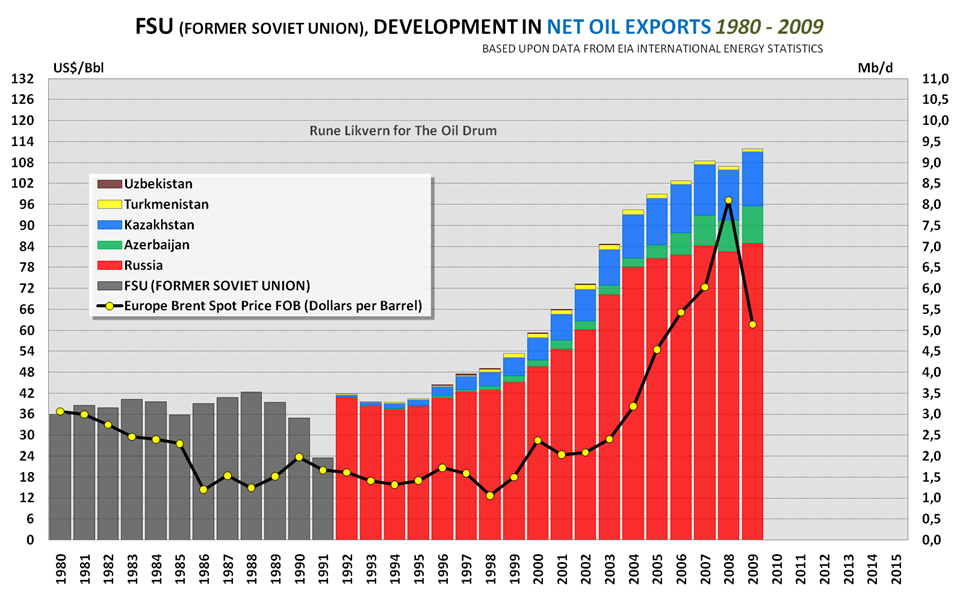
Figure 06: The stacked columns in the diagram above show development in FSU (Former Soviet Union) net oil exports of liquid energy (crude oil, condensates, NGLs and other liquid energy) from 1980 to 2009. The development in the annual oil price (Brent) is plotted against the left hand y-axis.
Apparently the events leading up to the collapse of Soviet Union with declines in its net oil exports from the late 80s had little effect on the oil price. This happened while OPEC had the capability to grow its share of world net oil exports.
The growth in oil supply and net exports from FSU in recent years gives some food for thought about how things may have been without this.
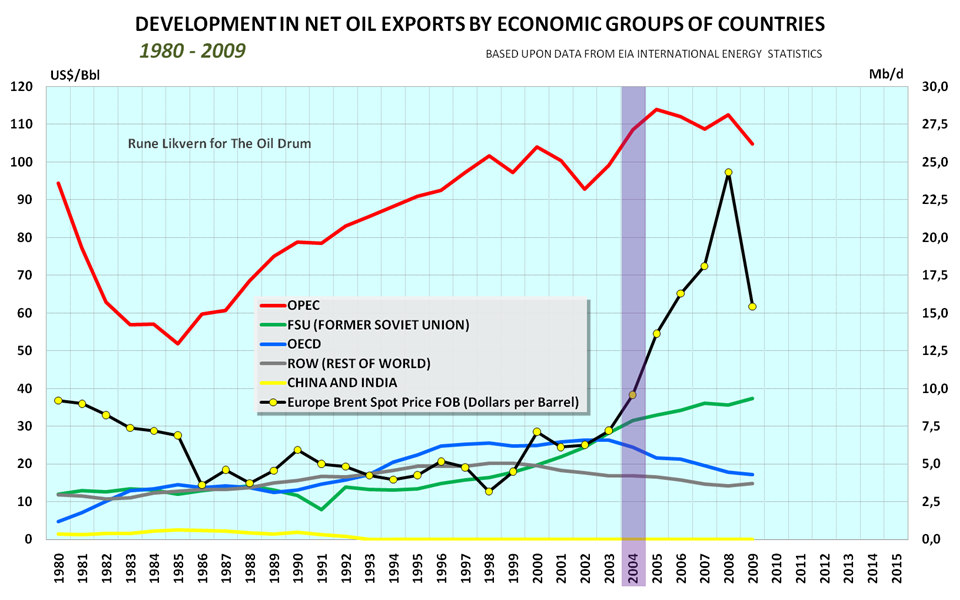
Figure 07: The lines in the diagram above show development in net oil exports for each of the 5 groups of countries presented here. The development in the average annual oil price is plotted against the left hand y-axis.
To me, 2004 appears to be the year when the oil price revealed that the world supply/demand situation was getting tighter. Total net oil exports from OECD, FSU, (China + India) and ROW reached a high in 2004, leaving OPEC as the only group of countries with the potential to still increase net exports.
Note also the uptick in the oil price in 2000 when OPEC provided a major part of the growth in net oil exports.
Between 2002 to 2005, OPEC increased their net oil exports by 5,3 Mb/d, while the oil price more than doubled.
The continued growth in the oil price between 2005 and 2008–which did not result in any growth in net exports from OPEC–strongly suggests that OPEC was maxed out in these years.
The full picture is probably better understood if developments in consumption (demand) are presented together with developments in oil supply.
The world totals relating to supply and consumption may differ slightly. This is now believed to be mainly due to stock changes, but the fact that some data are still estimates subject to future revisions, may also play a role.
World Oil Consumption and Net Oil Imports
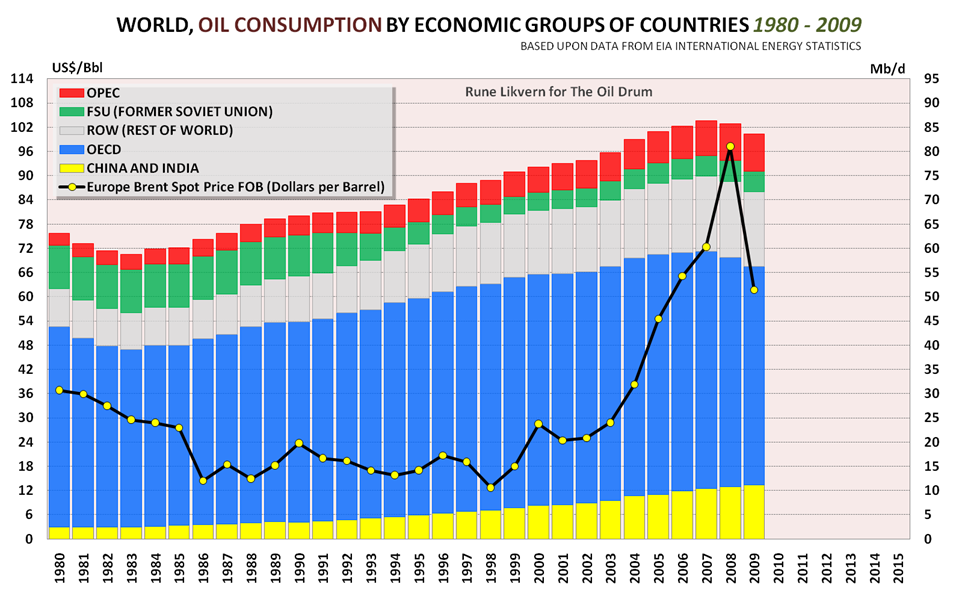
Figure 08: The stacked columns in the diagram above show development in world consumption of liquid energy (crude oil, condensates, NGLs and other liquid energy) from 1980 to 2009, split among 5 economic groups of countries. The development in the annual oil price (Brent) is plotted against the left hand y-axis.
OECD has so far had a high in oil consumption of 49,5 Mb/d in 2005 which declined to around 45,1 Mb/d in 2009.
The chart illustrates that the growth in oil consumption from (China + India) has not (yet) soaked up the entire decline in OECD consumption in recent years.
Oil consumption for ROW (Rest Of World) countries had a slight decline from 2008 to 2009. These may reflect effects from the financial crisis and/or the oil price.
Oil consumption within OPEC has seen growth in all the years presented in the Figure 07. Between 2003 and 2009, it grew from 5,9 Mb/d to 7,7 Mb/d or 30 %.
Presently the areas of the world with growing consumption are OPEC and (China + India). Between 2000 and 2009, these two groups of countries increased their oil consumption by 6,8 Mb/d which is more than 55 %.
For the first half of 2010, world supply of oil (all liquids) has been around 86,0 Mb/d, which is 1,6 Mb/d more than in 2009 and around 0,5 Mb/d more than in 2008.
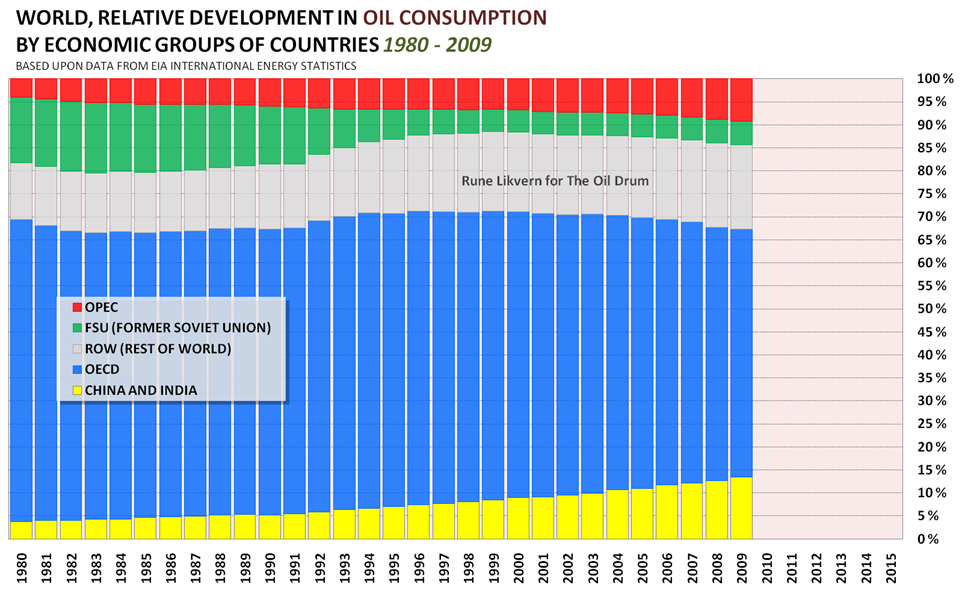
Figure 09: The stacked columns in the diagram above show relative development in world oil (all liquids) consumption for the 5 economic groups of countries presented here.
The chart above shows how OECD’s share of world oil consumption has shrunk while (China+India) and OPEC’s share has grown during the last 15 years.
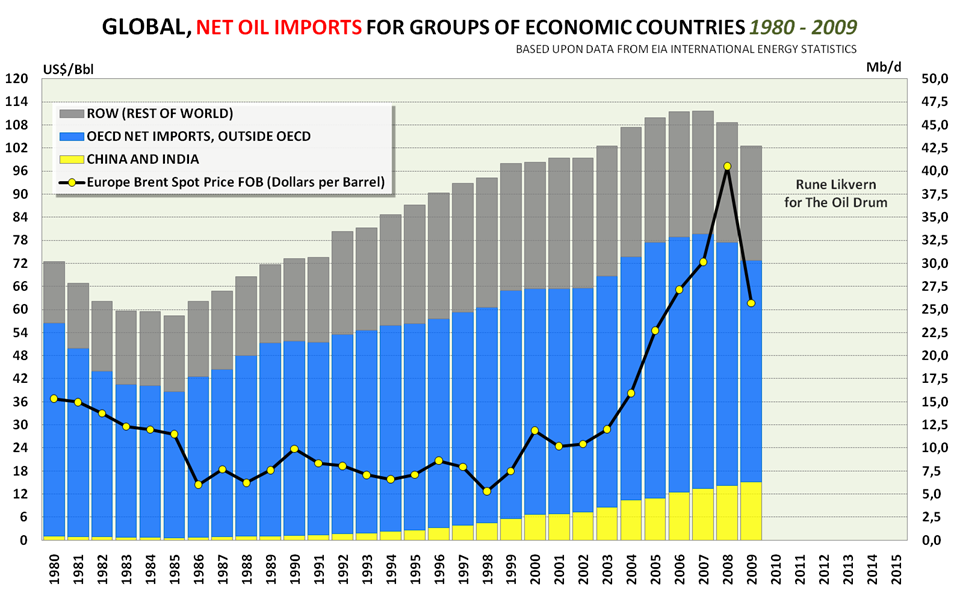
Figure 10: The stacked columns in the diagram above show development in world net oil imports of liquid energy (crude oil, condensates, NGLs and other liquid energy) from 1980 to 2009, split among 3 economic groups of countries (OPEC and FSU are net exporters). The development in the annual oil price (Brent) is plotted against the left hand y-axis. NOTE: net oil imports are here presented as the difference between consumption and production for the importers. Adjustments for stock changes may impact the annual numbers a little in either direction.
The chart illustrates that the decline in OECD oil imports in the recent years has not been completely mopped up by (China + India)’s growth in oil imports.
ROW reached a high point in net oil imports in 2001. Net oil imports declined by 1,7 Mb/d or 12 % between 2001 and 2009. ROW’s share of world net imports declined from above 30 % between 1991 and 2004 to around 29 % after 2004.

Figure 11: The stacked columns in the diagram above show relative development in world oil (all liquids) net imports among 3 economic groups of countries. FSU and OPEC are net exporters.
To me it appears that we are now witnessing a race between demand, supplies and decline rates, and as long all the wheels on the world economy remain on, oil price movements will give an important signal about the supply/demand balance. This race may soon come to test the remaining marketable world oil spare supply capacity.
SOURCES:
[1] EIA, INTERNATIONAL PETROLEUM MONTHLY, SEPTEMBER 2010
[2] EIA, INTERNATIONAL ENERGY STATISTICS
[3] EIA, SHORT TERM ENERGY OUTLOOKs (STEOs)
[4] IEA, OIL MARKET REPORTS (OMRs)


