
This is a guest post by Marco Bertoli. Mr. Bertoli has an economics degree from Bocconi University in Milano and a master’s degree in “social and economic disciplines” from the Milano Politechnical University.
At the end of February, The Oil Drum published an article I wrote called Efficiency and Resilience: After Jevons Paradox, the Piggy Principle. Its content was a strictly theoretical discussion of energy efficiency and its impact on the consumption and resilience of societies.

However, the time has come for us to verify that what was predicted by the model in fact happens in the real world. It might be interesting to understand if the conclusions drawn in the article were wrong or are at least somewhat close to reality.
Overview
Here is a brief summary of the basic thesis contained in the article, which we are going to double-check by using some data: according to the Consumer Choice Theory and the Piggy Principle – both concepts being considered as basics in any course of economics, but curiously passed by – it is not energy efficiency in consumer goods, but the price of energy and individual income that determine energy consumption per capita.
Efficiency, however, plays an important role in increasing the level of societies resilience.
Total energy consumption is the product of the consumption per capita and the number of consumers: we cannot help but consider the demographic variable when studying these phenomena – which is systematically ignored by official sources.
It can all be summarized in the following graph:

As a test, it is useful to examine the key variables for private mobility in the United States, for the period post World War II to date. These key variables are gasoline consumption and prices, mileage, car efficiency, and income.
For these variables, it is possible to easily obtain long-time series of data from official sources that are suitable for the scope of this analysis. The spread of these series also lets us observe the ‘big picture’ without drawing false conclusions due to the slenderness of the observed sample.
However, we should keep in mind that the example of private cars in the U.S. is only one of countless examples of energy consumption: we are not referring to universal laws applicable to every type of energy (heating, electricity consumption of appliances, etc.), at differing times and locations. On the contrary, if readers are aware of counter-examples, please post them.
Review of Test Data
So let’s go through data in detail.
When considering data regarding gasoline consumption per capita since the early 1930s (Source: Federal High Way Administration FHWA, thanks to Metacaffeination) and comparing them with historical series of average real hourly wages from 1947 (Source: Bureau of Labor Statistics, BLS. The series ID is CES0500000032), we have the following result:
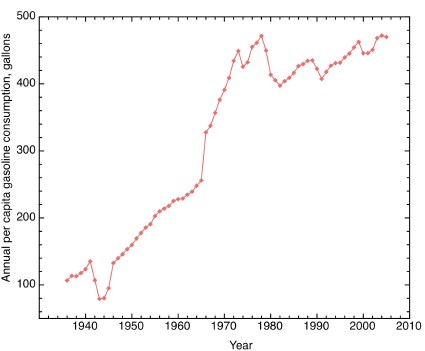
As you can see, the correlation is really impressive.
Leaving aside our astonishment after seeing so clearly that real wages – therefore the purchasing power of workers – have been stagnant for over 40 years, we should first clear up some doubts that may arise when looking at this correlation.
First, someone may ask what happened to the price of gasoline. We should not forget that this is included in real wages, which correspond to the ratio between nominal earnings and the Consumer Prices Index. In turn, the latter is a value proportional to the cost for the basket of consumer goods selected by the BLS. And it is well known that gasoline and its price are included in this index and directly influence it.
A second question could be why there is such a strong relation with wages, whereas that disappears when considering the real gross national income per capita.
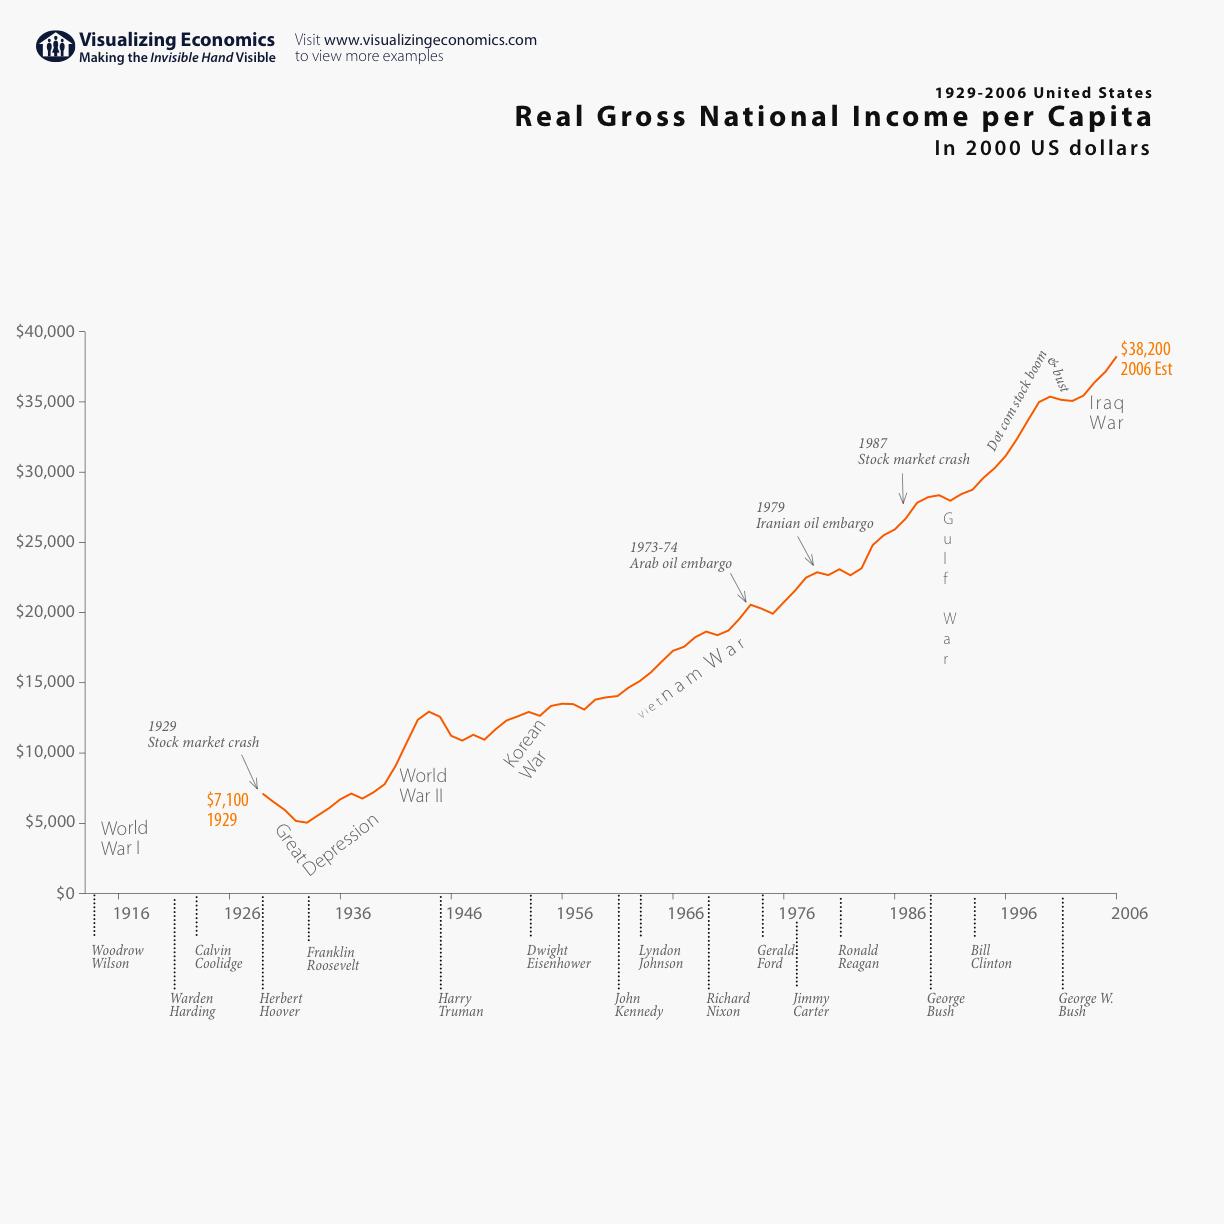
Gross National Income per capita is closely related to GDP; it is the sum of all gross incomes in an economy: wages, dividends, interest, rents and capital gains. As we know, in a society where residence, work, shopping and meeting places are very far away from each other, where public transportation is weak and private mobility is based on the car paradigm, gasoline becomes a basic necessity. As a basic necessity, gas is purchased each year by nearly every family, but for the overwhelming majority of them, the main source of income is wages, (although for the richest the capital gains from investments is to be deducted).
Moreover, the percentage of income spent on the purchase of gasoline and other basic necessity decreases as per capita income increases–in other words, the poor spend a greater proportion of their income on gasoline than the rich. For the poorest groups of population, wages are also the main source of personal income, together with government transfers.
So, to simplify, when the purchasing power of wages varies, the change is largely directed to consumption of basic goods. Similarly, the variability of dividends, rents, etc. can be thought of as determining the change in the consumption of ‘luxury’ goods.
A last criticism to be prevented is the use of ‘gross’ variables. We should remember that consumption depends on personal income, which is equal to net income plus government transfers (pensions, unemployment aids, tax reliefs, transfers to publicly owned enterprises providing services of first necessity like water, healthcare, etc.). In the case of low incomes, and thus of low wages, transfers offset taxes with a redistribution effect. Therefore, gross wages are a good approximation – underestimated – of personal incomes of both the workers and the poor.
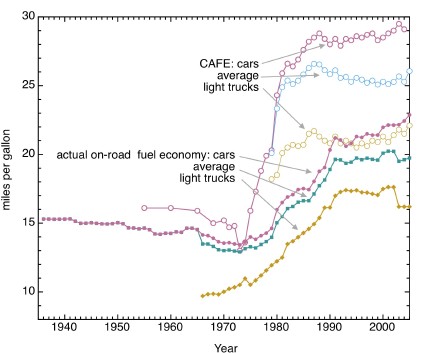
So, in this context, which is the role of cars’ efficiency?
As you can see in the chart as below, the average efficiency of cars in use in the U.S. was constant from the 1930s through the 1970s, rising rapidly till the 1990s (Source: FHWA, thanks to Metacaffeination). It is then clear the correlation with the oil shock and the regained abundance due to the resumption in Russian production in the 1990s. And not incidentally, after the 2008 oil shock, the debate on engine efficiency was back in the news.
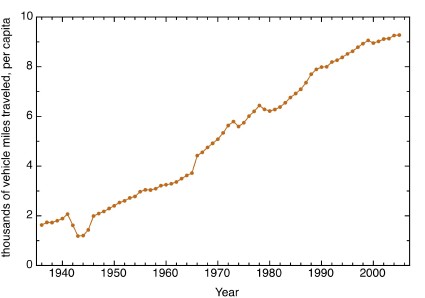
Now, if we approximate the individual utility with miles traveled per capita (see chart below), it can be easily shown that, in this case, the Piggy Principle really prevents improvements in efficiency from reducing gasoline consumption per capita.
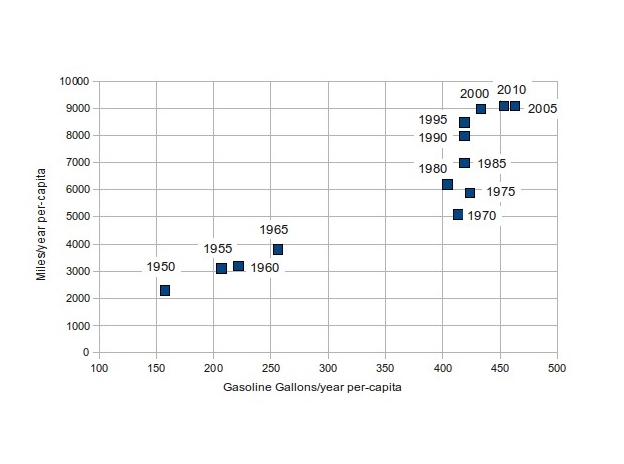
So, if we build a dispersion graph with miles traveled per capita (on the y-axis) and gasoline consumption per capita (on the x-axis), we can get a good approximation of the first chart that correlates consumption per capita and Utility:
Analysis of Results
Going back to the figures, we can identify two different periods in which the variables behave in a uniform way.
First Period: Post-WWII to 1970. Skyrocketing real wages and unchanged efficiency.
During this period, the growth in miles per capita and in gasoline consumption is caused solely by the peak of purchasing power of wages. Efficiency itself has no role in those years, remaining unchanged or even slightly decreasing.
Second Period: from 1970 to the 2000s. Stagnant wages and quickly increasing efficiency.
In these years, wages remained flat for 40 years, causing gasoline consumption per capita to stop rising. Efficiency improvements led to the growth of miles traveled per capita (Utility) that, in accordance with the Piggy Principle, consumers prefer to the reduction of fuel consumption for unchanged mileage.
We can add some controversy to this simple analysis. These data show that for the majority of people, the steady-state economy is a 40 year-old reality. In fact, as long as wages remained unchanged, utility improvements were reached only through efficiency improvements. . .
I guess there is no need for me to go any further in producing here data on productivity (real GDP / employee), which has always been closely tied to the growth of wages.
To conclude the analysis, let’s move from the consumption per capita to total consumption, which is the key variable for both the oil peak and global warming:
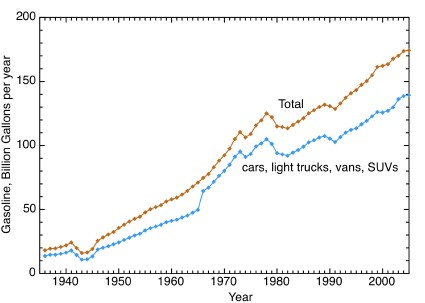
As we see from the chart, for private cars, the total consumption of gasoline is growing.
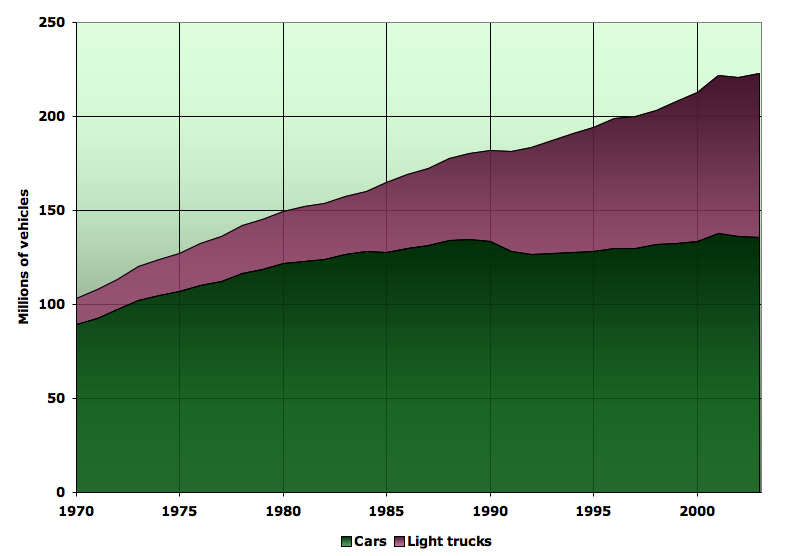
If consumption per capita has remained constant since 1970, this effect can only be due to the rise in the number of drivers. Obviously this can be ascribed to demographic dynamics only.
Continuing with the controversy, how many times did you find the word ‘demography’ in the ‘proposed policies’ paragraphs of the IEA or EU reports?
Finally, let’s check if it is true that efficiency has an important role in the improvement of resilience of societies.
To do this, we should look for an indicator for the ‘hit’ striking societies with the rise of gasoline prices and check whether the effects are reduced by efficiency. As we said earlier, wages – and therefore the majority of the population – are severely affected by the rise in the price of goods that are necessities. In fact, in these cases, the rich may draw down savings or cut back on luxuries, but the poor have to cut down on other important goods and on gasoline itself. That being said, the ratio between the nominal price of gasoline (source: EIA) and nominal gross hourly earnings (Source: BLS, Historical B-2) represents the time that has to be worked in order to buy a gallon of gasoline. It can be considered to be a good representation of the ‘hit’ suffered by the society.
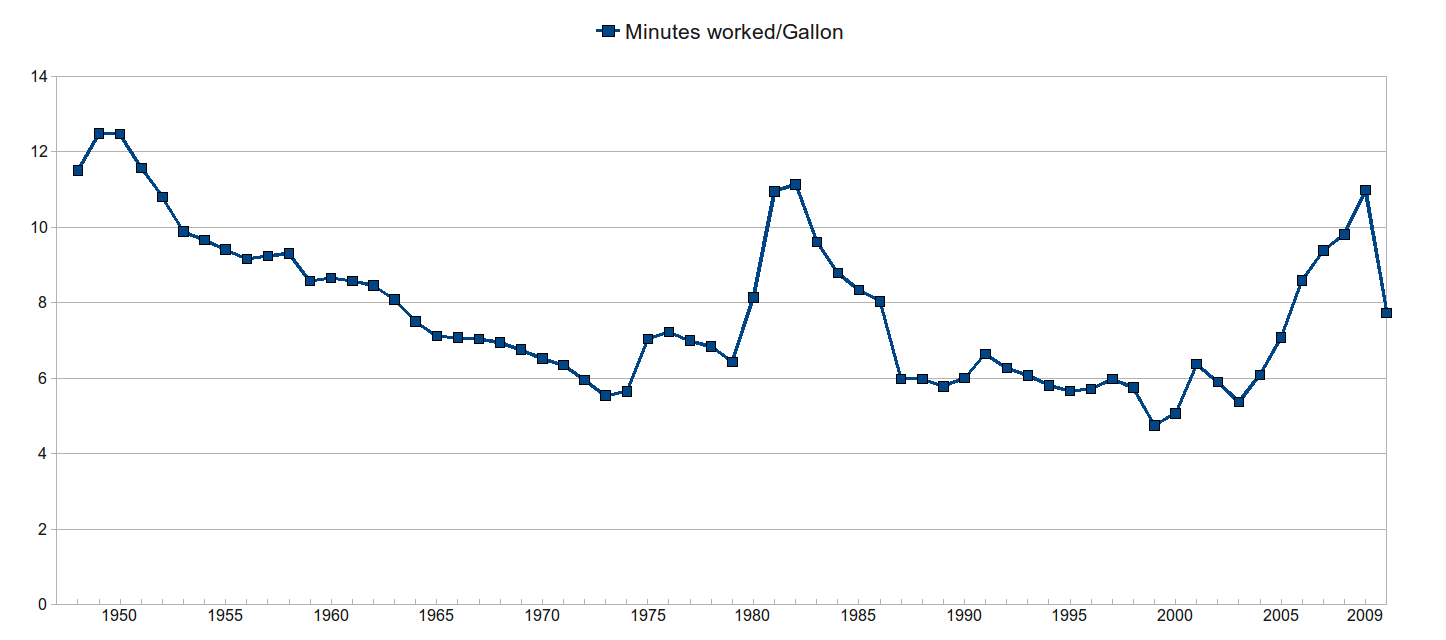
During the oil shocks of 1979 and 2008, to buy a gallon of gasoline workers had to work for 11 minutes, about twice the time needed when gasoline was at its lowest price.
The social effects cannot be quantified unequivocally, but we cannot forget that in 2008, unlike 1979, there were no queues at gas stations and there was no rationing and so on. Above all, this was largely due to the fact that, facing a peak in prices, drivers were able to cut the unnecessary consumption of gasoline (for leisure trips, etc.), which would have never been reached with the 1979 engine efficiencies. Compared with 1979, in 2008 efficiencies increased by 33%.
In conclusion, the theoretical idea has a good match with long-term statistics.
So, at least for this example, the poor practice of some economists – avoiding any comparison with real data and relying on abundant and evanescent speculation – was not followed. And this poor practice is coming from a long-time, noble and glorious tradition – still in very good health, though – which was condemned by Sir William Petty for the very first time: it was in 1676.


