Today is “Tax Day” in the US–the day that income taxes are due for 2009. Another on-line group asked for submission of tax related articles for Tax Day. The audience there is not particularly peak oil aware, so I put together this post.
When we think about the taxes and the federal deficit, we don’t usually think of Social Security and Medicare, because in government lingo, the payments we make for these programs aren’t taxes, they are contributions, and the funding deficit for these programs is not taken into account in determining the federal deficit.
If we think about the situation, though, the difference is really academic. The payments we (and our employers) make to Social Security and Medicare are very close to taxes, and the fact that the programs are underfunded is not taken into account in determining the federal deficit doesn’t make the problem any less real. If the programs are to be maintained at current levels, young people will have to pay much higher contributions–doesn’t this sound a lot like debt?
I think, though, that the funding situation for these programs is likely to be even worse than the actuarial forecasts project. The actuarial forecasts assume that the economy can continue to grow as it has in the past, and that wages will continue to rise. The forecasts also assume that population will continue to grow. With these assumptions, the plans tend to stay fairly close to in balance, with contributions, as percentages of wages, remaining unchanged.
The problem is that we live in a finite world, and our resource use cannot continue to grow forever. In fact, we likely will need to reduce the use of some resources because we are reaching limits, such as depleted fresh-water aquifers and less available oil supply (higher prices compared to pre-2004 norms). We may also decide to limit fossil fuel use because of climate change concerns. If we are reaching limits such as these, there is a substantial chance that incomes will no longer grow as they have in the past, making the funding of future promised benefits even more problematic than actuarial forecasts would suggest.
Typical View of Funding
Many people believe that somehow the contributions they and their employers make to Social Security and Medicare are set aside for them, earn interest, and when the time comes, will be there for them.

This is quite far from the truth (although this impression is fostered by calling the programs insurance programs). When Social Security was first begun, it was simply a pay-as-you-go system.
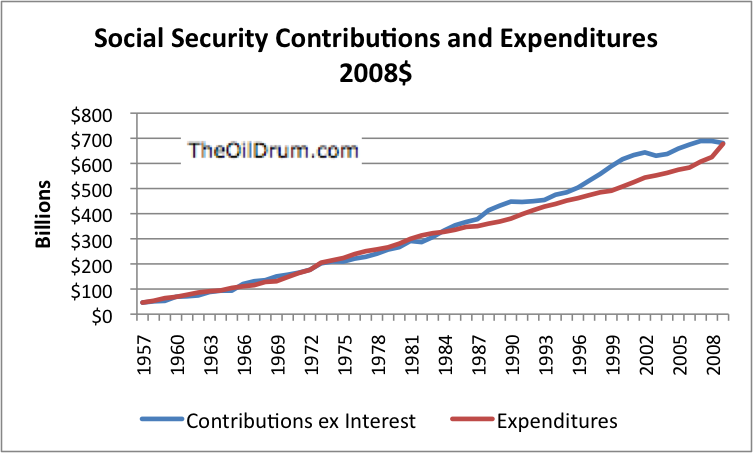
One can see from Figure 2 that up until about 1986, differences between contributions and expenditures were very small. It was as if the cost of benefit payments in a given year was divided among the current working population. After about 1986, there is a greater difference between contributions and expenditures, but the amounts are still fairly close because the funding assumptions assume a fair amount of real growth in wages will occur in the future, limiting the need for advance funding.
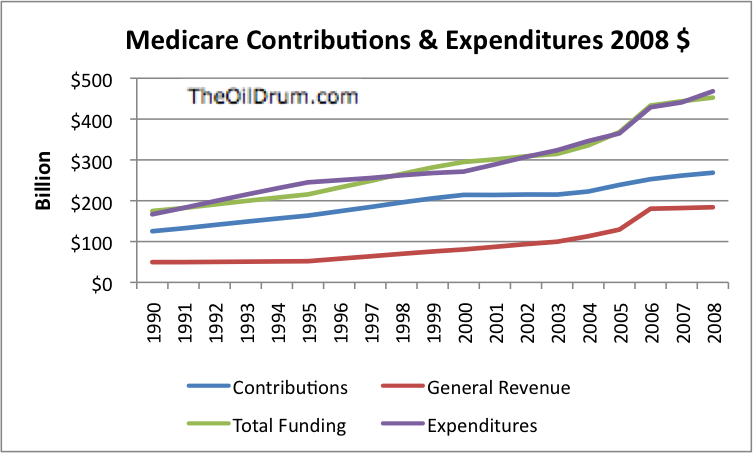
If one looks at the spreadsheet of Medicare contributions, one finds that expenditures match up fairly closely with the sum of “Contributions” plus “General Revenue,” implying little advance funding. Detail data indicates while the “Hospital Insurance” portion of the program is funded by contributions, the other portions (Supplementary Medical Insurance and Drug coverage) rely to a significant extent on general revenue.
What Happens to Excess Funding
The amount of excess funding for Medicare is pretty minimal, but for Social Security, at least up until to 2009, there were several years when substantial extra funds (the difference between Contributions and Expenditures) were being collected.
What happens to these excess funds? There are different accounts with different names, but when one looks beyond the rhetoric, what, in fact, happens is the government takes the contributions that exceed needs on a pay-as-you go basis and spends them on whatever else it might need tax revenue for–salaries, roads, the war in Iraq or Afghanistan, or whatever. In its place, it leaves IOUs in the form of special issue bonds and certificates of indebtedness. As of the end of 2009, the amount of these bonds amounted to $2.5 trillion dollars, and the average interest rate was 4.688%. These bonds are held in trust funds. For more information, see Social Security and Medicare Trust Funds: An Expanded Exposition.
Because of the availability of these funds, the US government has less need for borrowing from “outside”–for example China or Japan. For example, at the end of 2009 Wikipedia shows the US having gross debt of $12.3 trillion dollars, and “Debt held by the public of $7.8 trillion dollars. By subtraction, $4.5 trillion dollars of debt is held by government agencies. Social Security Trust Fund debt is $2.5 trillion out of this $4.5 trillion dollars. The other $2 trillion dollars relate to other government programs where the expenditures were lower than cash flow (perhaps because of premiums collected in advance). The advance funding in these programs were treated similarly to Social Security and Medicare–that is, the excess funding was spent, and US government debt substituted for it, allowing the US government to borrow less from outsiders.
From the point of view of those putting together the financial statements for Social Security and Medicare, the US government bonds are assets paying interest, and thus reduce the need for Social Security contributions. But let’s think about this. Where is the money going to come from, both to repay the government debt, and to pay interest? It can only come from higher taxes. So while Social Security contributions may be a bit lower, essentially the same individuals will likely have to pay higher income taxes (or other taxes) in the future to repay this debt plus interest, so the benefit of this whole arrangement is much less than it might otherwise would be.
The actuarial reports for Social Security and Medicare talk about when the trust funds for these organizations (containing US government debt) will have exhausted their balances, because outflow will exceed income for enough years that all of the US government debt will need to be redeemed. While this is one date of interest if you are running the trust funds, it seems to me that at least an equally important issue is when it is no longer possible to use Social Security and Medicare as an easy place to get funding for government programs (war in Iraq, or whatever), without having to sell bonds to outsiders. Once expenditures start exceeding contributions on an annual basis, the US government loses a place to conveniently fund its debt, and is forced to borrow more from other sources. Based on Figure 3, we seem to be reaching the point now where expenditures exceed contributions for Social Security. If trends continue, and expenditures start to materially exceed outflow, it may be necessary to further ramp up external governmental debt because of the loss of internal debt financing provided by Social Security.
The Role of Limited Resources
If a person stops to think about it, paying for Social Security and Medicare benefits on a pay-as-you-go basis isn’t quite as dumb as it sounds. In some real sense, all beneficiaries can receive in a given year is goods and services that the economy can produce in that year. These goods and services are a subset of the total of the total goods and services produced by the economy, since the workers who produce the goods and services will also have to have shares as well.
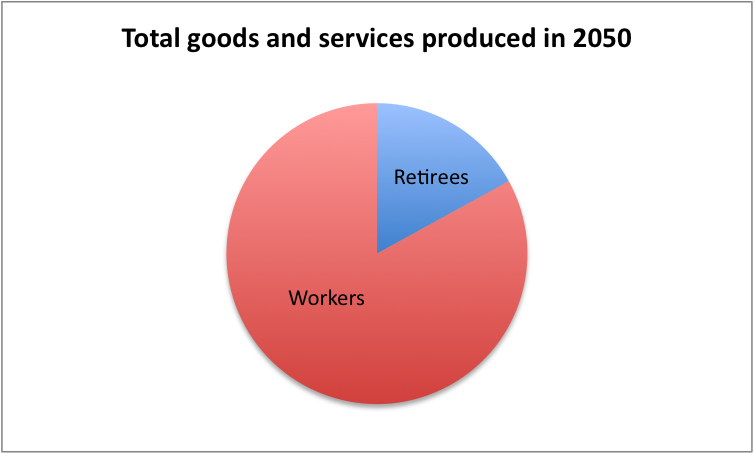
Each worker or benefits recipient receives a tiny sliver of the total “pie” of goods and services available. While there is some variability in the size of this “pie” because a service giver or manufacturer can choose to produce more output, this output is limited by necessary inputs. For example, if gasoline or diesel is in short supply, fewer goods may be manufactured, and food may be in shorter supply, because diesel is used in cultivation, transportation, and refrigeration. If fresh water pumped from the Ogallala Aquifer is in short supply, less corn may be grown in the Plains States, leading to less ethanol and less food for animals.
Where We are Now with Respect to Resource Limits

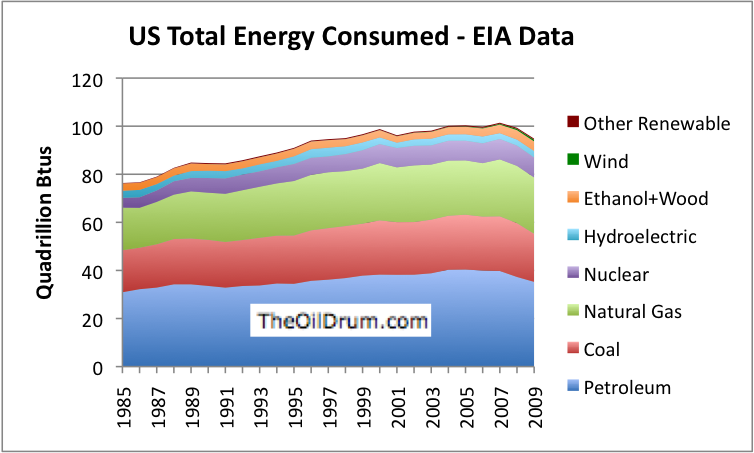
Unfortunately, we are already getting to the point where resource limits are affecting economies. Figure 5 shows that world oil production hit a plateau, starting about 2004. Figure 5 shows data only through 2008, but production for 2009 still is on the same flat plateau. Since world population is growing, this means on average, less and less oil products are being produced for each person. The limiting effect of reduced oil supply ripples through world financial markets, either as higher prices or (something which is less recognized) reduced credit availability.
Oil is used for a lot of things–food production, manufacturing new cars, and in building new homes. The constricted supply of oil has no doubt played a role in the recent economic contraction–for example, with higher oil prices after 2004, homes in distant suburbs no longer were as desirable, leading to loss of demand and lower prices for these homes.
To offset the failure of oil production to expand, Figure 5 shows that there has been a huge ramp up of coal production, and a smaller ramp up of natural gas production. But coal and gas are not very good substitutes for oil–they can be used to produce electricity, but electricity doesn’t fuel our long haul trucks, or supply asphalt to pave our highways, or fill many other roles now handled by oil products.
The ramp-up of coal has been mostly in lesser-developed countries, but the US and other developed countries received the benefit of this ramp up, through cheap goods imported from abroad. Long term, the ramp up of coal is not a very good strategy from a climate change point of view–coal is the worst fossil fuel from a point of view of CO2 emissions, and carbon capture and storage is a long way away from a feasibility point of view.
Going forward, there are differing views on whether world oil production can again be ramped up, or if it will soon begin to decline. We know that in individual locations, oil production seems to reach a maximum level, and then start declining.
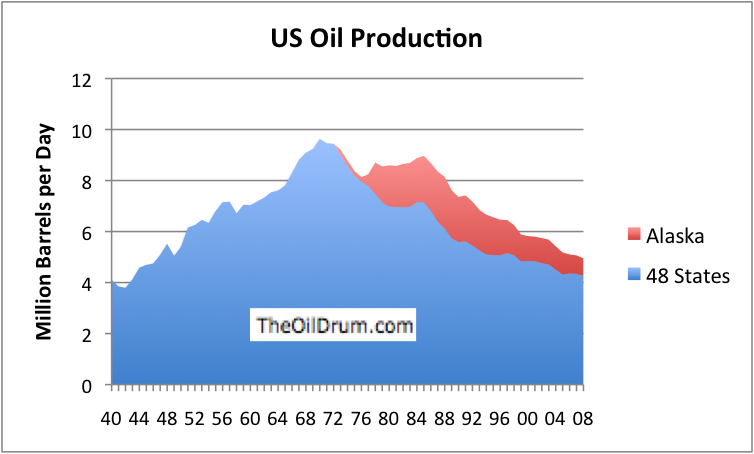
As an example, oil production for the US 48 states (excluding Alaska and Hawaii) reached a maximum in 1970. Drilling was then started in Alaska, and production reached a peak there a few years later. The same pattern has occurred in many areas around the world where liquid oil is produced – the North Sea, Mexico, and in something over half of the oil producing countries in the world, lead most observers to believe that eventually liquid oil production for the world will begin to decline. At this point, world oil production is approximately flat, as shown in Figure 5.
There are various solid forms of oil, which theoretically have longer, flatter production patterns, which might possibly be ramped up to offset declining liquid oil production. For example, a huge amount of oil is theoretically available from the oil sands in Canada, but extraction is very slow and expensive. . Oil can also be produced by heating kerogen (found in oil shale) for long periods, but this procedure is also expensive and slow to ramp up. It remains to be seen whether sources such as these will have provide more than a very minor impact.
There are many estimates as to when world oil production will decline. This recent US military report says (page 29):
By 2012, surplus oil production capacity could entirely disappear, and as early as 2015, the shortfall in output could reach nearly 10 MBD [million barrels per day].
The National Petroleum Council put out a report called Facing Hard Truths about Energy Supply, in response to a request by Samuel Bodman, who was at that time Secretary of Energy. The report talks about the need to ramp up energy resources of all types, in response to growing demand and uncertain future supply.
An estimate by Tony Eriksen (“ace”) of The Oil Drum shows world oil production beginning to decline in 2011.
Even without a significant decline in world oil production, Figure 8 shows that the US has seen its oil consumption decline in the last couple of years, as China and the oil exporting countries take more of the available oil. While some would argue that this decline is the result of the recession, a good case can be made that the causality is as more the other way around–high oil prices, starting as early as 2004, had an adverse impact on the US economy. James Hamilton is one economist who has shown a connection between high oil prices and the current recession. The adverse impact of oil on the economy is also frequently mentioned by Energy Secretary Steven Chu. Figure 8 shows that renewables have played a very minor role, and do not come close to offsetting the decline in available oil supply.
If oil is in short supply going forward, there is a significant chance that what we have seen as the recent recession will continue or will reappear, after a short intermission. In fact, the recession may well get worse. A cutback on other energy sources, such as coal, would likely cause further recessionary impacts, as would a widespread shortage of fresh water.
What is this Likely to Mean for Social Security and Medicare Funding?
Social Security and Medicare funding are done through contributions that are computed as percentages of wages. If wages do not rise, because of recession, neither will contributions to these programs, and this lack of contributions is likely to be a problem. If a person looks at Figure 3 (shown above), one can see that there has been a very distinct flattening of Social Security funding in the last three years, as wages have plateaued.
At the same time, expenditures have tended to continue to increase. A big part of this arises from the fact that many people are now reaching retirement age, because the oldest baby boomers are now 64 years old. With layoffs more frequent, and jobs less available, some may choose to take benefits early, rather than look for another job. Figure 3 seems to show a larger uptick in expenditures recently, as if more are taking retirement benefits when other options are not available.
If, in fact, we are now hitting resource limits, the patterns of the past couple years may repeat themselves. In Figure 9, I show a very rough idea of what kind of impact this might be expected to have on the Social Security program. Trends toward high expenditures and flat contributions would continue. Eventually, high unemployment rates and lower wages would have an impact on benefits received, but before this happens, contributions (based on wages) would likely fall far below expenditures.
I have not tried to make any forecasts for the Medicare program, but note that even with the current actuarial estimates, expenditures are shown as rising much more rapidly than Social Security expenditures. Medicare expenditures are now about 75% of Social Security expenditures, but by the late 2020s, Medicare expenditures are expected to exceed Social Security expenditures. If contributions are based on flat, or possibly even falling salaries, this would cause a real funding problem. (Of course, plan administrators would have the option of raising contributions or reducing benefits to fix this problem.)
Solutions
There are no easy solutions. Population growth has always been encouraged, because such growth makes it easier to fund benefits for a rising population of seniors. It also gives spreads the US debt over a broader base.
But if resources are limited, the last thing we need is a growing population. We would be better off with a smaller population, so that earth’s limited resources can be shared among a smaller number of people, providing more for each person. If families start having only one child each, this would be helpful from a resources point of view, but it would make it even more difficult to pay off out all of the outstanding debt, in addition to paying for Social Security and Medicare benefits for all the seniors.
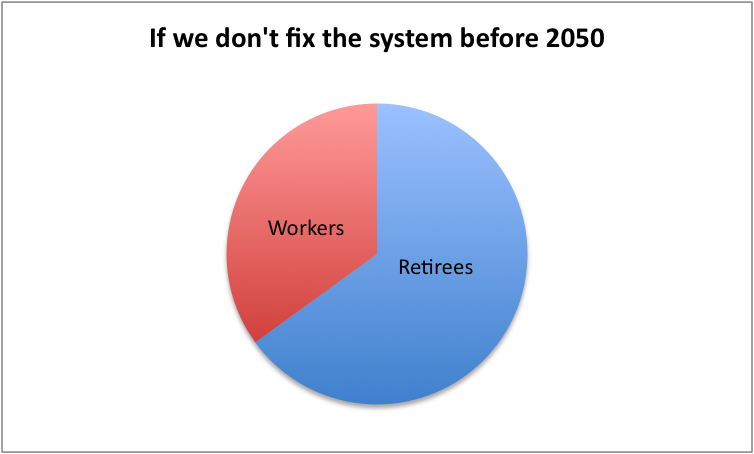
I think we need to assume that eventually Social Security and Medicare benefits will need to be cut back–otherwise the retirees’ share of the resource pie will just become too large. This will especially be an issue, if resources in total are declining, so everyone is poorer. Social Security and Medicare will not be an easy issue to fix, because all of us are affected, and no one will welcome the changes. Politicians are likely to continue to find the issue very difficult to deal with.