The following multi-part series is taken from a paper that my colleagues and I published last year in the free, on-line journal Energies. You may access the entire PDF here. All references can be found in the pdf. Part 1 can be found here.
The first section of this post discusses how the economic cost of energy changes with changes in the price of energy. The second section discusses the impact of declining EROI on economies; specifically this section addresses whether or not the time trend of EROI supports the claim by some economists that advances in technology will overcome the depletion of fossil fuels. The third section discusses how surplus energy is used to run the economy by analyzing a simplified economy that is powered by oil only.
2.2. Economic Cost of Energy
In real economies, energy comes from many sources – from imported and domestic sources of oil, coal and natural gas, as well as hydropower and nuclear, and from a little renewable energy – most of that as firewood but increasingly from wind etc. Most of these are cheaper per unit energy delivered than oil. So let’s look at what this real ratio of the cost of energy (from all sources, weighed by their importance) is relative to its benefits.
Economic cost of energy = Dollars to buy energy / GDP
By this token the relation of the proportional energy cost in dollars is similar, as we shall see, to the proportional energy cost in joules; in 2007 roughly 9 percent (1 trillion dollars) of the U.S. GDP was spent by final demand for all kinds of energy in the US economy to produce the 12 trillion dollars worth of total GDP (Figure 1). This ratio certainly increased in the first half of 2008 as the price of oil exceeded $140 a barrel and then fell again. The abrupt rise in the 1970s, subsequent decline through 2000, and increase again through mid 2008 of this value had large impacts on discretionary spending because the 5 to 10 percent change in total energy cost would come mainly out of the 25 or so percent of the economy that is discretionary spending. Thus we believe that changes in energy prices have very large economic impacts. At least thus far the changes in price seem to reflect the generally decreasing EROI only sporadically although that seemed to be changing recently until the economic crash of fall 2008, when collapsing demand took over. What future prices will be is anyone’s guess but even as economies crash there is a great deal of information implying that dollar, and hence presumably energy, costs of fuels are increasing substantially. Our guess is that declining EROI will take a huge economic toll in the future [6].
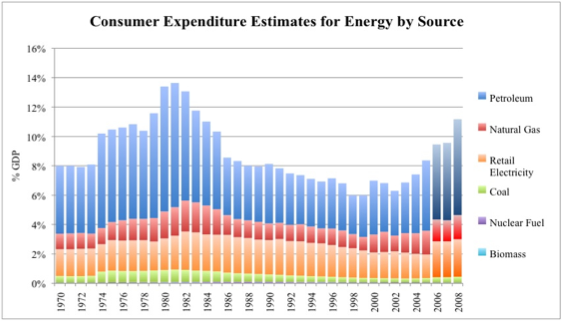
Figure 1. Percentage of GDP that is spent on energy by final consumers (2006-2008 estimated).
2.3. EROI for U.S. and North American Domestic Resources and Its Implications for the “Minimum EROI”
In the past the first author worked with Cutler Cleveland and Robert Kaufmann to define and calculate the energy return on investment (EROI) of the most important fuels for the United States’ economy. Since that time Cleveland has undertaken additional and updated analyses for the US economy and Nate Gagnon and Hall have attempted to do that for the world average. Our results indicate that there is still a very large energy surplus from fossil fuels — variously estimated as an EROI (i.e. EROImm) from perhaps 80 to one (domestic coal) to perhaps 11-18 to one (US) to 20 to one (World) for contemporary oil and gas. In other words, globally for every barrel of oil, or its equivalent, invested in seeking and producing more oil some 20 barrels are delivered to society. Thus fossil fuels still provide a very large energy surplus, obviously enough to run and expand the human population and the very large and complex industrial societies around the world. This surplus energy of roughly 20 or more units of energy returned per unit invested in getting it, plus the large agricultural yields generated by fossil-fueled agriculture, allows a huge surplus quantity of energy, including food energy, delivered to society. This in turn allows most people and capital to be employed somewhere else other than in the energy industry. In other words these huge energy surpluses have allowed the development of all aspects of our civilization — both good and bad.
That’s the good news. The bad news is that the depletion of fossil fuels has been occurring since the first ton of coal or barrel of oil was mined, since these fuels need about 100 or so million years to regenerate. Many economists argue that technology, the market and economic incentives will continue to find oil to replace that which we have extracted, or that prices will increase as oil reserves deplete and society will substitute away from oil as technologies are developed that allow for such a substitution [21]. Thus one can argue that depletion and technology are in a race over time. Which is winning?
We argue that one can determine this from the time trend of EROI. The EROI for oil in the US during the heydays of oil development in Texas, Oklahoma and Louisiana in the 1930s was about 100 returned for one invested [22]. During the 1970s it was about 30:1, and for about 2000 it was from 11 to 18 returned per one invested [3, 4, 22]. For the world the estimate was about 35:1 in the late 1990s declining to about 20:1 in the first half decade of the 2000s (Gagnon et al. in preparation). In addition there is considerable evidence that, in the case of oil, we are mostly just pumping out old fields rather than replacing extracted oil with newly found oil. Globally we are using between 2 to 3 barrels for each new barrel found [23]. The analysis of Gagnon et al. suggests that if current trends continue linearly then in about two to three decades it will take one barrel of petroleum to find and produce one barrel of petroleum, and oil and eventually gas will cease to be a net source of energy. (A special case can be made for e.g. tar sands, where it may make sense to extract two barrels from the ground, use one for the process and then deliver the second barrel to society). This also means that the question is not necessarily what the size of global oil reserves is but rather what is the size of that portion that is extractable with a positive net energy value and at what rate the high EROI fuels can be produced. The implications of this are obvious and huge, and help make an argument for seeking possible substitutes earlier rather than later [6].
But the problem with substitutes to fossil fuels is that of the alternatives available none appear to have the desirable traits of fossil fuels. These include: 1) sufficient energy density 2) transportability 3) relatively low environmental impact per net unit delivered to society 4) relatively high EROI and 5) are obtainable on a scale that society presently demands (Figure 2). Thus it would seem that society, both the US and the world, is likely to be facing a decline in both the quantity and EROI of its principal fuels. Our next question is “what are the implications of this?”
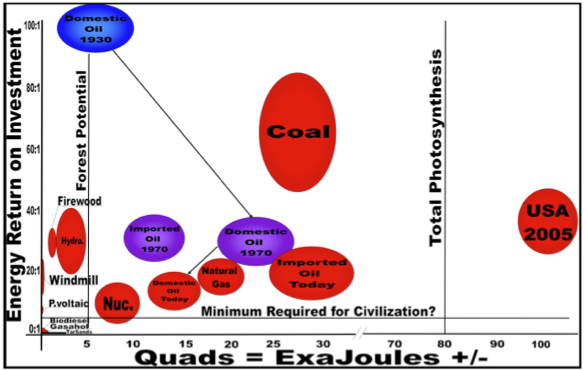
Figure 2. “Balloon graph” representing quality (EROI – Y axis) and quantity (X axis) of the United States economy for various fuels at various times. Arrows connect fuels from various times (i.e. domestic oil in 1930, 1970, 2005 – “today”), and the size of the “balloon” represents part of the uncertainty associated with EROI estimates, i.e. larger “balloons” represent more uncertainty. The horizontal line indicates that there is some minimum EROI that is needed to make society work, and the vertical line to the left indicates one estimate of maximum forestry potential and the vertical line to the right is David Pimentel’s earlier estimate of total photosynthesis in the United States (Source: US EIA, Cutler Cleveland and C. Hall’s own EROI work in preparation). (Reprinted with minor changes from [6]).
3. The surplus available to run the rest of the economy
We first generate a simplistic view of the economy in every day units to try to develop for the reader an explanation of how an economy obtains the energy needed for its own function and how differences in EROI might affect that. Assume for the moment that the United States’ economy runs 100 percent on domestic oil, and that energy itself is not what is desired by the final consumer but rather the goods and services derived from the general economy. In the early years of this new millennium the U.S. Gross Domestic Product (proxy variable for the size of the U.S. economy) was about 12 trillion dollars, and it used about 100 quadrillion BTUs (called Quads, equal to 1015 BTUs), which is equivalent to about 105 ExaJoules (1 EJ equals 1018 Joules). Dividing the two we find that we use an average of about 8.7 Mega Joules (1 MJ equals 106 joules) to generate one dollar’s worth of goods and services in 2005. By comparison, gasoline at $3 per gallon delivers about 44 MJ per dollar (at 130.8 MJ per gallon of gasoline), plus roughly another ten percent to get that gasoline (refinery cost ≈ 4 MJ), so if you spend one dollar on energy directly vs. one dollar on general economic activity you would consume about 48/8.3 or 5.8 times more energy.
In the 1970s analyses were undertaken by Bullard, Hannon, Herendeen [24] and Costanza [25] that showed that (except for energy itself) it does not matter enormously where money is spent within final demand due to the complex interdependency of our economy (that is, the final products that consumers buy are relatively unimportant to overall GDP/energy efficiency because there are so many interdependencies, i.e. each sector purchases from many others within our economy, although this does not apply to the intermediate products purchased by manufacturers). According to Costanza [25], the market selects for generating a similar amount of wealth per unit of energy used within the whole economic “food chain” leading to final demand. While this is not exactly true it is close enough for our present purposes and it is certainly true for the average of all economic activity.
What is the energy “price” of the oil in this example to 1) the country (either domestic or if it is imported) and 2) to the consumer — relative to the total economic activity of each entity? One can do some simple math. There are about 6.1 GJ in a standard 42 gallon barrel of oil, so the 105 EJ of industrial energy the U.S. uses to run its economy for a year is equivalent to roughly 17 billion barrels of oil. At $70 per barrel that amount of oil would take 1.2 trillion dollars to purchase (or at 3 dollars a gallon, 2.1 trillion to the consumer), which is either about one tenth of GDP, or one sixth if we consider it from the perspective of the consumer (the difference between the two estimates going to the oil companies after production or to refineries, gas station attendants etc. as inputs, profits, wages, delivery costs etc.). Thus the price of energy delivered to the consumer is roughly twice that of the wellhead price (or much more if converted to electricity).
Now assume that the real price of oil, that is the price of oil relative to other goods and services, increased by two, that is to $140 a barrel in today’s dollars (which it did briefly in 2008), and that the total size of the economy stayed the same – that is some other components of the economy were diverted to pay for that oil. If that happened, then one fifth (17 billion times 140 = $2.38 trillion/12 trillion) of the economy would be used to buy the oil to run the other four fifths (that is that part not including the energy extraction system itself). If the price of oil increased to $250 per barrel, about one third of all economic activity would be required to run the other two thirds, and at $750 a barrel then the output of the entire economy, that is 12 trillion dollars, would be required to generate the money to purchase the energy required to run the economy, i.e. there would be no net output. While in fact in a real economy there would be many adjustments, alternative fuels and nuances this analysis does at least give an overview of the relation of gross to net economic activity, and the importance of EROI in energy and economic terms to the rest of the economy. As the price of fuel increases (or as its EROI declines) there are large impacts on the rest of the economy. These impacts can be especially influential because changes in the price of energy tend to impact discretionary, not base, spending.
Of course most of our energy costs less than oil so that the 70 dollars a barrel we used in the example above translates to – in the real economy — the equivalent of about $35 a barrel equivalent at the source or $70 a barrel by the time the consumer gets the energy, hence we can assume for this scenario that on average about 10 percent of the dollar economy (i.e. $70 times 17 billion barrels or 1.2 trillion out of 12 trillion dollars) is used just to purchase the energy that allows the rest of the economy to function, which produces the end products we want. This 10 percent of our economic activity means that roughly ten percent of all workers’ time, ten percent of the energy used in their jobs, and ten percent of the total materials consumed were used in some sense to simply get the energy to the final consumer to make the rest of the economy work. According to the official statistics of the U.S. Energy Information Agency in 2007 the cost of energy to the consumer was about 9 percent of the total U.S. economy Figure 1), so our numbers seem about right on average.