
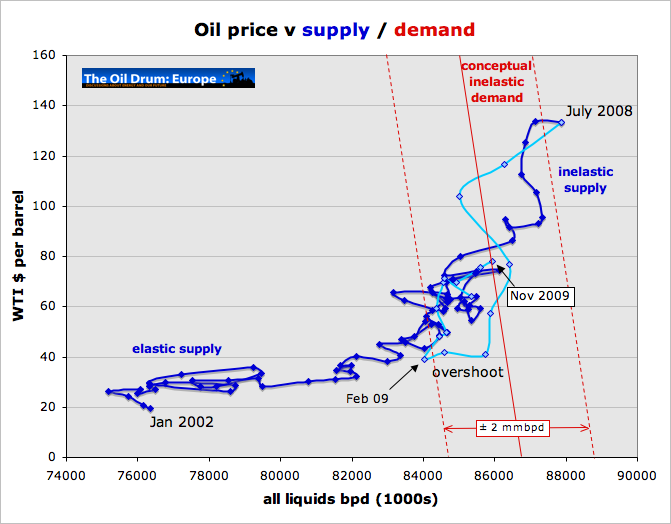
Figure 1 Oil supply – demand – price chart, Jan. 2002 to Nov. 2009. See text for explanation. Click to enlarge and open in separate browser window.
In February this year, global oil production / demand hit an interim low of 84.0 million barrels per day (mmbpd) and the average price of West Texas Intermediate (WTI) that month was $39.16 / bbl. Since then, demand has recovered to 85.9 mmbpd in November and the average price was $78.08 / bbl. A rise in demand of 2.3% has led to an oil price rise of 99.4%.
Full explanation of the chart and a discussion of what 2010 might have in store is below the fold.
Every year about this time I meet with an old university friend, who is also a geologist, and we make a bet on where the oil price will be in a year’s time. My “forecast” from a year ago:
My forecast is $80, based more on hope than anything else.
My friend bet $55 and so, with Brent on $71.50 (17 Dec 2009) it looks like I will win that pint of beer this year, based more on luck than anything else. It has always been near impossible to forecast the oil price, but since 2002 we have entered a supply constrained situation where the relationship between supply, demand and price seems to allow a more informed approach to predicting the future. So what does that chart up top tell us?
Supply, demand and price
The chart up top is based on this simple model presented by Phil Hart in this rather excellent post.
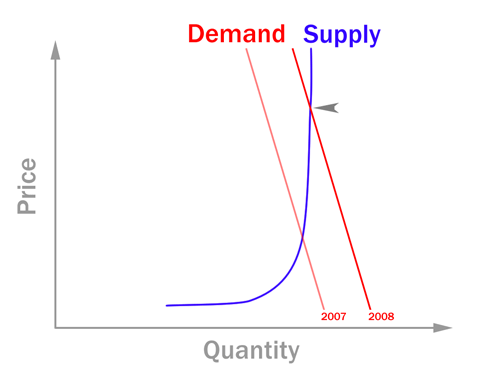
Figure 2 Phil Hart’s oil price, supply, demand model.
It remains a source of great surprise for me that the monthly average production and price data for the last 8 years still fits this model. There are a number of wild card variables that one might expect to produce significant deviations, such as variable OPEC spare capacity, changes to global productive capacity, speculation and currency fluctuations. And yet the data fit this simple model remarkably well.
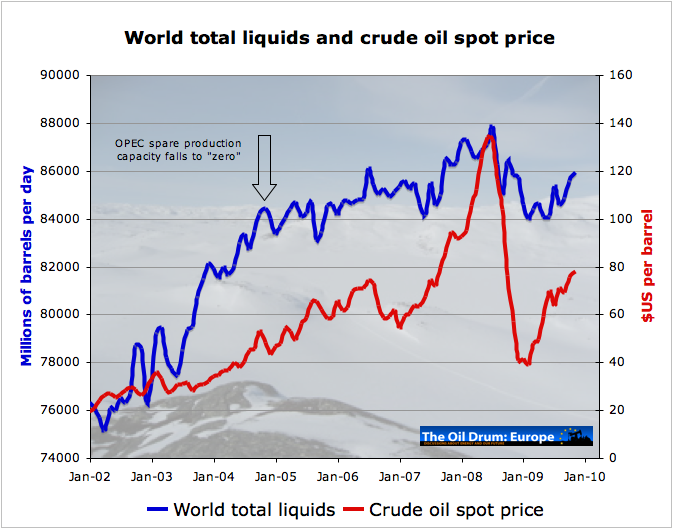
Figure 3 Oil price and supply. Oil price data from Economagic.
The chart up top (Figure 1) is a simple cross plot of the data plotted above (Figure 3). Figure 1 is a time series of monthly average oil price and production volume figures from the IEA (kindly provided to me by Rembrandt). The story starts in January 2002 (bottom left) and wanders a month at a time up to July 2008 (top right) which was the peak. At first the trend is quite flat since below 82 mmbpd supply is quite elastic, i.e. there was ample new low cost supply to meet rising demand. But then, above 82 mmbpd price began to rise with rising production / demand and at 84 mmbpd OPEC spare capacity fell to effectively zero late 2004 (Figure 3). At that time new capacity had to be built to replace production lost by decline, that is roughly 5% of 84 mmbpd = 4.2 mmbpd new capacity per annum just to stand still. The oil industry was working flat out, and with an oil service sector unable to meet demand, rates went through the roof together with the oil price as supply became inelastic.
Eventually in July 2008 the Olympic peak was reached, Lehman Brothers went bust, the credit crunch consumed the world economy and the oil price retraced its upwards path (pale blue line) settling on $39 / bbl and 84 mmbpd in February 2009 as demand fell 4 mmbpd as recession set in.
Since February, the oil price has made a strong recovery to around $80, retracing about half of the losses of last winter. All of this activity can be explained by inelastic demand interacting with inelastic supply, albeit that OPEC spare capacity may be switched on and off at the will of OPEC countries, mainly Saudi Arabia.
So how can this help predict what the future might hold? In simple terms, should the relationship in Figure 1 continue to hold, then the future oil price will be determined by demand and the problem is reduced to forecasting global oil demand – no simple task. Note that from the current position of 86 mmbpd, an increase in demand of 2 mmbpd will take the oil price back up towards last summer’s peak whilst a fall in demand of 2 mmbpd will take the oil price back down towards $50 / bbl. The task boils down to understanding the outlook for the global economy.
Outlook for 2010
The only thing I feel I know for sure about the future right now is that it is uncertain. There is a large degree of sureality here in Aberdeen. The UK is in the midst of the longest and deepest recession for many decades. And yet life seems to be continuing pretty much as normal. The shops are busy and the streets are still lined with Porsches, Mercedes and Audis. But all is far from well. The School where my younger boy is just completing his final year has lost several teachers in the last two years with more cuts to come. My wife works at the University where her salary is now effectively frozen. News of cuts to public spending and capital projects abound. The UK has run up mind boggling debt in the blink of an eye and is printing money like there is no tomorrow (Box 1). While growth has returned to most major economies, the UK is the sick man of the bunch, suffering badly from being top heavy in phantom GDP provided by a terminally ill financial sector.
Box 1 – Basket Case Britain

UK Government chart. I’m uncertain what the left chart shows, apart from the post August 2009 data are off scale. Right side shows net cumulative debt as % of GDP. As GDP has fallen by 4.75% and borrowing has grown out of control to support social programs, the UK debt:GDP ratio has increased exponentially. Symbols show the default situation, line shows actual situation that includes government lending to banks.
UK Government chart. Left side shows annual government deficit as % of GDP. The 2009 / 10 situation will be much worse. Right side, cumulative debt as % of GDP. 2009 / 10 will show deterioration. 60% line is EU target limit.

Certain events will take place in 2010, all of which are likely to have a negative impact upon the prospects for the UK.
- There will be a general election in May, and leading up to that the full significance of our perilous finances will be on show for the population and the world to see
- Cash for clunkers will end in January, it is hard not to see that this will send the motor industry and all the industries it supports back into a tail spin.
- VAT (sales tax) reduced from 17.5 to 15% in a desperate attempt to stimulate the economy will be raised back to 17.5% shortly.
- The banks, who now seem to run the country, are introducing draconian charges for short term consumer borrowing – £1 per day for overdrafts up to £2500 – that works out at effective interest of 15% for an annual requirement of £2499. Poor people, who have not understood the implications of this will be fleeced, with the blessing of our socialist government.
- UK government spending must fall. This will squeeze wages, raise unemployment, and this will filter down to the retail sector and housing market. The tax take from government spending will fall.
- At some point quantitative easing (QE) must end, and my understanding is that this will send long term bond yields upwards with consequences for the broader market.
You may gather that I am not optimistic about the prospects for the UK in the year ahead. The current stock market rally and resumption of growth in OECD economies has been manufactured to large degree by QE, currently running at around £200 billion in the UK. This is relative to GDP of around £1.5 trillion. QE is like a sticking plaster over a gaping hole in a grossly over inflated credit bubble.
The chart below which shows the relationship between earnings (PE ratios) and the value of the S&P500 is one of the more sobering charts I have seen. Unless there are reasons to believe that the US economy will make a robust recovery next year then some form of equilibrium must surely be restored to the market. Sharply lower stock markets will likely trigger a new round of deep woes for global finance markets. Stoneleigh eloquently summarised the case for a deflationary bust in this interview / post.
Figure 4 S&P 500 PE ratio history, courtesy of Decisionpoint.com. The chart was lifted from an email article by Brian Bloom, author of Beyond Neanderthal. The recent fall in PE curves reflects Q2 2009 GAAP adjusted PE ratio of 148 as reported by Brian Bloom. I cannot vouch for the veracity of this information, perhaps some posters would care to comment?
I believe 2010 will be a year of high volatility, and this makes it difficult to predict where we might be at year’s end. But since I have to stick my neck out, I will predict an oil price of $40 / bbl one year from now with global production / demand running at around 82 mmbpd. This is little better than a wild guess, and there are a multitude of alternative outcomes. In the near term, the oil price may go higher, but the higher it goes, the more stress will be placed on an ailing global economy and this will hasten the next stage of economic contraction. This oil accordion (credit to Nate) was well illustrated in this comic strip by John Kinhart.
If readers wish to post their own analysis and prediction then I will summarise these predictions at the end of this post and we can revisit this a year from now. The prize for the nearest prediction, Brent Blend spot price at the close of 17 December 2010, will be kudos.
Wishing all readers a merry Christmas or whatever festival you chose to celebrate. And its worth recalling the sound advice of Nate – there is a lot more to life than money. Make friends and build social capital.
Euan Mearns
December 2009
shox My guess is that the overall average for 2010 will be $95 a barrel.
goghgoner $67
Zaphod42 More like $120 and $60 for a range in USD. IMO $40 is a tad low and $80 seems way below probabilities.
steve from Virginia I think prices will be lower in a year $55 – 60
Perk Earl Price will rise to the 85-99 range as depletion continues and increasing US debt lowers value of the dollar.
garyp So say $38 if people haven’t come to terms with the hard oil limit, or $152 if they have and have started to price oil according to a post peak reality.


