
Abstract
Introduction
Carrying Capacity and Logistic Growth
An Energy Model of Population Growth
Biomass Population
Coal Population and the Industrial Revolution
Oil Population and the Twentieth Century
Natural Gas Population and the Twenty-first Century
The Sum-Of-Energies Population Model
What Next? – Future Scenarios
Scenario 1: Continued Fossil Fuel Consumption Growth
Scenario 2: Fossil Fuel Decline and no Sufficient Substitute
Scenario 3: Fossil Fuel Decline and a New Energy Source
Summary
Bibliography
Abstract
This paper investigates the link between population growth, energy resources and carrying capacity at a global level, to determine if there might be dependencies and if so, how they could be modelled. Different qualities of energy resources may interact differently with population growth. Finally the implications of a peak in energy resource availability on population growth are examined.
Introduction
The Population Division of the United Nations predicts a global population of approximately 9 billion people in 2050[1]. That is over 2 billion more people than are alive today. This mantra – 9 billion in 2050 – is so ingrained in our and our media’s psyche, that the forecast is no longer questioned.
Using these numbers – 9 billion people in 2050 – the world’s two main energy agencies, the International Energy Agency (IEA) and the Energy Information Administration (EIA), then extrapolate past and current trends in energy consumption, and forecast how much energy we will need in the future. So population growth determines our energy consumption forecasts [2].
What determines population growth? What has been the cause of the unprecedented growth in world population in our recent history? Many socio-economic reasons are given as explanations: medical advances, improvements in public health, sanitation and hygiene, increased food availability and agricultural productivity, extension of cultivation, and development of trade and transportation. Surprisingly, high quality energy sources are rarely mentioned or quickly discounted[3]. Yet an argument can be made that each of the above factors contributing to population growth is aided and influenced by high quality energy supplies. Cheap and abundant fossil fuels have been a necessary precondition for the past century’s population growth. And while not all countries benefit directly from the consumption of high quality energy supplies, most countries benefit from the impact of high energy societies on low energy societies.
What if energy consumption, or more precisely, energy resource availability, somehow determines population growth? Perhaps energy resources determine the Earth’s carrying capacity, or how many people the Earth can support? Perhaps different energy resources have different effects on population growth? If we hypothesize that the Earth’s population is ultimately determined by availability of energy resources, and if some of those energy resources are at or near their peak rates of production, then that may affect rates of population growth. If the correlation is strong enough, the number of people the Earth can support may also be at or near its peak. Therefore the number of people in 2050 may be very different from widespread United Nations (UN) forecasts.
Growing populations consume more energy. Availability of energy allows populations to grow. Energy consumption exerts demands on energy resources making them scarcer. They become harder to extract. Nearby forests are depleted, coal mines must dig deeper, oil has to be drilled in more complex environments. In other words, energy resource extraction experiences declining marginal returns. This has led to the exploitation of new energy sources, which in turn expands the Earth’s carrying capacity. Then populations grow once more.

Figure 1 – Population/Energy Dependency – Before Peak Energy Production
Perhaps, at a macro level, we can study this cycle of dependency and use it to model population growth, to try to understand where population might be headed in the future.
Carrying Capacity and Logistic Growth
Carrying capacity is a measure of the environment’s ability to support a given population. In reference to human beings, carrying capacity is a measurement of how many human beings can be supported. Typically this is a global measurement – how many people can the Earth support – but it could also be a measurement of a region, say, or an island. For example, we might ask about the carrying capacity of Great Britain, or of Easter Island.
Figure 2 shows a very simple representation of the standard population growth function, and illustrates the concept of carrying capacity. It has three main characteristics:
Early populations grow quickly, unimpeded by resource constraints.
As population grows, competition for resources grows.
Mature populations grow slowly to a ceiling, or carrying capacity (the orange line)

Figure 2: Logistic Population Model
Mature populations tend to reach equilibrium – the carrying capacity – and then fluctuate around this equilibrium. If a population outgrows its carrying capacity, regulating factors come into play, such as famine, or emigration. If a population is below its carrying capacity, birth rates tend to increase, so the population grows.
The common assumption is that carrying capacity is determined by the availability of food, water and land (this is Wikipedia’s definition). While availability of food and water are important factors in determining the carrying capacity of populations, they cannot explain the unprecedented increases in population that have occurred in the last several hundred years.
The availability of land has always been a factor in increasing carrying capacity. In the historic past, the Earth’s carrying capacity could be increased by expanding into sparsely occupied, or frontier, lands. In a fictitious future, carrying capacity could be increased by expanding outward to other planets or solar systems. At present, there is very little unoccupied, habitable land remaining on this Earth and no nearby habitable planets to release the pressure of population growth, so any increase in carrying capacity must be a result of other factors.
In an earlier paper (Zabel 2000a), I argued that populations exhibit a behaviour that could be described as punctuated equilibrium[4]. That is, populations exhibit long-term equilibrium at or near a carrying capacity. During brief and rare periods in history, population pressures lead to new technological or organisational shifts within society. What is interesting is that these shifts are always accompanied by the addition and commercialisation of a new, higher quality source of energy. Approximately 10,000 years ago the beginnings of a shift from hunter-gathering to farming entailed a shift from stone and iron tools to animal, water and wind power. Much more recently the transition in stages from pre-industrial societies, to industrial societies, to our modern economy corresponds to a progression from traditional energy sources such as wood (and animal, water and wind power) to coal to oil and natural gas. It is the exploitation and addition of new, higher quality energy sources that raise the Earth’s Carrying Capacity, and make these shifts possible.
|
Society |
Energy Sources (additive) |
Energy Type
|
Energy Quality
|
Carrying Capacity |
|
Hunter-gatherers |
stone and iron tools |
Traditional and Biomass |

|
|
|
Agriculturalists |
+ wind, water and draught animals |
|||
|
Pre-industrial societies |
+ wood |
|||
|
Industrial societies |
+ coal |
Fossil Fuels |
||
|
Modern Economy |
+ oil and gas |
|
Table 1 – Shifts in Societies accompany shifts in Energy Sources |
At present the world’s population is growing rapidly. The planet could not support the six billion plus people that exist today without first the commercialisation of coal, then of oil and, more recently, gas. These energy sources have been necessary for the unprecedented population growth that has occurred over the last three hundred years. It is reasonable to assume that unless current energy resource production is increased and new resources are exploited, the population will no longer grow. And if energy resources decline (e.g. a peak in production is reached), then we may see a decline in population.
An Energy Model of Population Growth
Roughly 10,000 years ago, increasing population pressure on wild food resources led to a shift from food gathering (hunter-gatherers) to food production (agriculturists) in several parts of the world. This led to demand-induced technologies and demand-induced searches for higher quality energy sources, such as “water power for flow irrigation, animal draft power, iron tools, and fire for land clearing and for improvement of hunting and pastoralism.” (Boserup 1981:46)
Population pressures in many parts of Europe in the seventeenth and eighteenth centuries led to serious shortages of wood which in turn led to many of the technological innovations that fuelled the Industrial Revolution. Coal’s replacement of wood as the most important source of energy in Western Europe is “a classic example of demand-induced innovation…promoted by population pressures on forested land in Western and Central Europe” (Boserup 1981:109).
From the end of World War II, coal’s premier importance as an energy source declined sharply and was replaced by crude oil. Far offshore drilling of oil began in 1947 off the coast of Louisiana. One year later, the world’s largest oil field, al-Ghawar in Saudi Arabia, was drilled. Large new discoveries of oil and gas in Africa and Asia combined with the development of oil super tankers and pipeline networks reduced the price of oil and gas at a time when the costs of producing coal were continuing to rise. Diesel locomotives represented a major substitution of oil for coal. The post World War II era also saw large increases in automobile ownership, the beginnings of highway and motorway road transportation networks and the first passenger jet aircraft –all benefiting from and encouraging consumption of cheap oil supplies.
These increases in the consumption of crude oil have coincided with the highest population growth in history. After the depressed population growth during World War II, growth rose quickly to a peak of 2.2% in 1964[5], the highest rate the world has ever known. (Per capita oil consumption peaked shortly thereafter, in the 1970s). Although population continues to rise, population growth has been declining since then.
If there is a relationship between energy consumption and population growth, the different types of energy consumed may have different effects. If biomass is the only energy source, populations will not grow very fast. In such organically based economies, “the problem of expanding raw material supply, and especially the related problems associated with the very modest energy supply maxima…must curb growth with increasing severity as expansion takes place”(Wrigley 1992:27-8). The emergence of coal as an energy source eliminated the carrying capacity limits to population growth that any traditional and biomass energy based culture would eventually face. Similarly, the predominance of oil after the middle part of the twentieth century raised the carrying capacity even further.
Following this hypothesis, a simple energy-based model of population growth can be divided into four components:
- Biomass Population – population growth due to biomass energy
- Coal Population – population growth due to coal
- Oil Population – population growth due to oil
- Natural Gas Population– population growth due to natural gas
Figure 3: Sum-of-Energies model of World Population
Each of these components can be modelled separately and then combined to create a sum-of-energies model of population growth.
This energy-based population growth model assumes a general pattern:
- introduction of a new energy source – raises population’s carrying capacity, and population grows towards that new limit
- energy source adoption matures – population growth due to that energy source slows, as competition for the energy source intensifies and its production reaches a peak
Biomass based populations can grow at a slow rate as long as there is frontier land to migrate into. If frontiers are fixed, growth stops and then fluctuates around this new equilibrium. Coal based populations are still growing, as coal production is still growing and is not yet close to peaking. Oil based populations grow quickly at first, but then slow as higher standards of living lower fertility – a phenomenon observed throughout the industrialised world. Once frontiers are closed and productivity gains have been realised, population growth begins to plateau, exhibiting the common S shape of the logistic curve.

Figure 4: Percentage of Total Calculated Consumption Contributed by each Energy Source
Sources: Jenkins (1989), WEC (1995), BP (2000)
Determining when the introduction of a new energy source can raise a population’s carrying capacity to a new level is not easy. One method that seems to fit with empirical observation is that an energy source becomes globally important when it attains a 20% share of the world’s energy mix. For coal, this occurred in 1860, oil in 1950, natural gas in 1990.
|
Traditional Renewables |
Coal |
Oil |
Natural Gas |
|
|
20% of Energy Share |
n/a |
1860 |
1948 |
1990 |
|
Energy Share Peaks |
pre-1850 |
1912 |
1973 |
2002 |
|
20% off Peak |
1860 |
1940 |
1996 |
n/a |
Table 2 – Energy Share Dynamics
Source: WEC 1995, page 10
The newly ascending energy source typically reaches 20% of the energy mix at about the same time as the dominant source has fallen about 20% from its peak. Table 2 shows how coal attained 20% of the energy mix in 1860, the same time that traditional renewables had lost 20% of their original 100% share. Oil attained a 20% share in 1948, shortly after 1940 when coal had dropped 20% from its peak of 1912. And natural gas reached a 20% share in 1990, while oil fell 20% from its peak shortly thereafter.
This then will be the criterion used to separate the effects of each energy source on the world’s population: when a new energy source attains a 20% share of the global energy mix, it has reached a level where it can upwardly shift carrying capacity.
The world’s population from the beginning of time until 1850, just as coal reached a 20% share of energy resources, will be referred to as Biomass Population. Coal Population reigns from 1850 until 1950, when oil reached a 20% share of energy resources. Coal Population is the population of the world not accounted for by the slowly growing Biomass Population. Similarly, Oil Population is the population from 1950 until 1990 that is not accounted for by either Biomass Population or Coal Population. Natural Gas Population starts in 1990, as it reaches a 20% share of energy resources. The diagram in Figure 4 illustrates these concepts.,[6]
According to the IEA, 1.6 billion people live without electricity[7]. Much of Africa and Asia still rely on biomass as their primary source of energy, yet have very high population growth rates. How can there be a correlation between energy and population in these instances?
While many developing world countries remain low energy societies, they, and their population growth rates, are impacted by high energy societies. Their primary energy sources may still be traditional biomass, but their population growth is due in large part to abundant oil and gas supplies. Vaccines and antibiotics that reduce third world mortality are discovered, produced and distributed with first world energy, and oil contributes at every step. Fertilisers, pesticides and herbicides that aided the Green Revolution in much of the developing world could not have been produced without large oil and gas inputs. The aeroplanes, boats and trains that deliver and distribute food all run on oil. While the commercialisation of higher quality energy sources may be very unevenly distributed, the societies that adopt new energy sources, high energy societies, have a profound impact on those societies that remain low energy societies, and these impacted populations then become part of Coal, Oil or Natural Gas Populations.
An examination of each component follows.
Biomass Population
Until 1850, most of the world’s population was still supported by traditional renewables (wood, dung, etc.) and animal power, with minor amounts of wind and hydropower. Britain was already heavily influenced by coal, but very few other populations were. In 1850, Britain was producing more coal than the rest of Europe combined. In the same year, when the population of the United States was 23 million, 90% of its energy requirements were still met from wood (Schurr and Netschert 1960:511). So until the mid-1800s, energy from biomass was the main energy contributor to population growth.
Biomass Population growth fluctuated in waves of feast and famine; economic growth and population checks[8]. If populations grew too quickly, living standards declined, local carrying capacities were exceeded and food became more expensive. Malthusian population checks ensued: later age at first marriage, decreases in life expectancy and higher mortality. Biomass Population had been growing at a very slow rate with some slight ups and downs for thousands of years.
Population pressures in Europe were partly relieved through the safety valves of migration. Settlers expanded into sparsely populated regions of the world such as North and South America, Australia and many African and Asian colonies. Thisenabled small upward shifts in the global population ceiling.
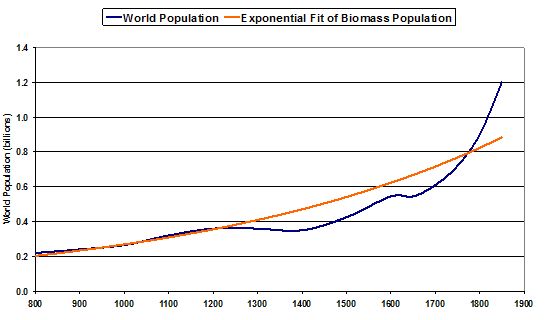
Figure 5: Biomass Population -World Population 800-1850 compared to Exponential growth
Source: McEvedy and Jones (1978)
Figure 5 shows the world’s population from 800 to 1850. The blue line represents the world population – when biomass was the predominant source of energy. The orange line is a fitted line representing exponential growth. Extrapolating the exponential trend line to the year 2000 gives a value of 1.09 billion people. This may be a rough indication of how many people the planet could now be supporting if coal, oil and gas were never commercialised, assuming there were still frontiers to expand into. Hypothetically then, a world based solely on biomass may feasibly support a magnitude of one billion people.
Coal Population and the Industrial Revolution
In 1750, the world’s population was approximately 720 million people. Over the previous 1000 years, this population had been growing very slowly at an average rate of about 0.13 percent. At this rate population doubles every 500 years and it would have taken over 1500 more years (sometime near the year 3250) to reach our current population of 6 billion people. Sometime in the 18th century, circumstances changed and population began growing rapidly.
Both oil and coal have been used in small quantities for thousands of years. But until the Industrial Revolution, human and animal power and traditional biomass sources fulfilled society’s energy requirements almost entirely. By 1850 population pressures led to the commercialisation of coal and the Industrial Revolution, and the energy derived from coal began to shape the forces that would raise the population ceiling.
Since the Industrial Revolution, populations have grown much more quickly. The countries that first experienced industrialisation were the first to grow more quickly. England, where the Industrial Revolution began, was also the first country to witness accelerated population growth. From the late 1700s, Britain’s population began to grow at levels never seen before. Previously, higher historical fertility rates were always more than compensated for by high mortality rates, putting a brake on population growth. Since 1541, the population of Great Britain never grew faster than it was growing by 1800[9]. By the 1820s, England’s population was growing annually at approximately 1.6%, a rate never surpassed before or since.
“Between 1550 and 1820 the populations of France, Spain, Germany, Italy and The Netherlands all appear to have grown by between 50 and 80 per cent; in England over the same period the comparable figure was 280 per cent, a contrast so striking that by 1820 England, which had once been a small country by the standards of the larger European powers, though still less populous than France, Germany or Italy, was moving rapidly towards rough equality with them” (Wrigley 1990:13). During the same period, Britain was mining coal in quantities unseen anywhere else in the world. “In 1800 the output of coal in Britain had reached about 15 million tons a year, at a time when the combined production of the whole of continental Europe probably did not exceed 3 million tons” (Wrigley 1990:54).
Between 1800 and 1900, the Industrial Revolution crossed the Channel and spread to the rest of Europe. So did the importance of coal. The commercialisation of coal that occurred in Europe in the eighteenth and nineteenth centuries dramatically increased productivity through the use of steam engines that drove trains, boats and many other engines, and through the coking process used to produce steel. Coal made available twice as much heat as an equivalent amount of dry wood (Wrigley 1990:54) – it is a higher quality energy source. By 1900, coal was powering the entire world’s major industrial processes, and powering the industrial nations’ population growth.
Between 1800 and 1900, Europe’s population more than doubled from about 187 million to 400 million. As a percentage of world population it climbed from 21% to roughly 25% (it is now down to about 12%)[10]. While this percentage increase does not seem very large, it doesn’t measure the roughly 35 million Europeans who immigrated elsewhere. These European immigrants and their descendants spawned large and often numerically dominant populations in many other parts of the world including the United States, Canada, Australia, New Zealand and many regions in Latin America. They also brought with them the European penchant for coal consumption. By 1865 coal had gained a 20% share of energy consumption in the United States. Shortly after 1880 coal became the main source of energy in the U.S. As a percentage of total consumption contributed by each energy source, coal consumption peaked in 1910 (Schurr and Netschert 1960:511). The year of highest population growth in the U.S. in the twentieth century occurred one year earlier, in 1909[11]. During this time frontiers were still open but were shrinking fast.
Coal greatly reduced pressures of land use. Wood for heating and fuel was replaced by coal, so the land needed to grow that wood could serve a new purpose. The large quantities of fodder for draught animals and horse transport were made redundant by coal and the machines driven on coal. This further reduced pressures on land use and freed large amounts for the increased use of agriculture for food for humans.
Coal also played a large part in the development of electricity. With the establishment of the electricity industry in the 1880s following the achievements of Edison, Parsons, Stanley, Tesla, Westinghouse and their collaborators, electricity quickly expanded to power households, industry and railroads. Electricity was generated in power plants, and those power plants were fed with coal. Still today, 50% of America’s power is generated in coal-burning power plants.[12]
1850 is chosen, then, as the year that the world began to feel the effects of coal. Around 1850 the world’s population began to grow much faster. For the first time in history, annual world population growth exceeded 0.5%[13]. Most demographers try to explain this growth in terms of economics or mortality decline rather than in terms of energy – in this case, coal consumption. Obviously, coal was important in British society much before 1850 and some continents would not feel the benefits of coal power until much later. But by 1850 coal was being mined extensively, canal transportation was growing quickly throughout Europe, the age of rail transport had begun and iron-works were commonplace. This led to increases in wealth, prices, distribution of foodstuffs, and internal and external migration. The substitution of human and animate power by machines and engines fostered the improvement of material conditions and quality of life. This process began in Britain, but the effects spread far and wide.

Figure 6: Population – World Population less Biomass Population 1850-1950
If we exclude the slowly growing Biomass Population from the total population between 1850 and 1950, we are left with Coal Population (Figure 6). Coal Population’s contribution to world population is then extrapolated backward to 1800 and forward to the year 2020.
The model predicts that Coal Population grows in a logistic manner. That is, population initially grows fairly quickly but eventually a coal population ceiling is reached. Unlike oil and natural gas, whose population ceilings are more likely to be determined by limits to production capability, Coal Population’s ceiling may result through the limits to coal production demanded by a world more and more concerned about climate change. Because coal emissions are the dirtiest of the fossil fuel emissions, pressure to reduce coal use grows with concern over the potential climate altering effects of increased carbon dioxide emissions.
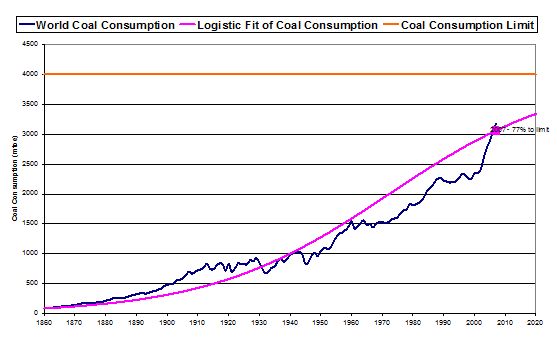
Figure 7: World Coal Consumption 1860-2007
Sources: Jenkins (1989), BP (2008)
This model assumes that annual coal consumption will peak at approximately 4 Gtoe.(Current annual world coal consumption is approximately 3.2 Gtoe (giga-tonnes oil equivalent). This value is somewhat arbitrary but fits with the World Energy Council (WEC 1995) future energy Scenario B, their Business-as-Usual scenario which estimates coal use at 3.4 Gtoe in 2020 and 4.1 Gtoe in 2050. Again, future coal consumption is seen as being limited more by environmental concerns and cleaner alternatives than by the amount of world coal reserves.
If we assume that Coal Population grows in a similar manner to coal consumption then both logistically growing coal consumption (Figure 7) and logistically growing Coal Population (Figure 6) reach approximately 80% of their limits in the year 2007. At these current and projected rates of coal consumption, coal might be expected to support roughly 2.5 billion people this century.
Oil Population and the Twentieth Century
Before a coal population ceiling was reached, a new source of energy replaced coal’s dominance. Oil was the next source of energy to be commercialised.
Oil is easier to handle than coal. It is cleaner burning and cheaper to transport and store, making it ideal as a transportation fuel. It was able to further increase productivity.
Oil provides the energy needed to grow and distribute food, and to increase the nutritional content of agricultural produce. Extensive land, air and sea transportation networks enable easy distribution of food. This stimulates mortality decline by getting food to the people that need it, alleviating local food shortages, flying food aid to drought stricken regions and shipping grain to countries whose populations have grown larger than their output of food.

Figure 8: Oil Population – World Population less Biomass and Coal Population 1950-2007
From 1950 to 2000, Oil Population is derived by excluding Biomass Population and Coal Population from the world’s total population. Oil Population is plotted in Figure 8 along with a fitted logistic curve. The graph shows that currently over 2.5 billion people are supported by oil.
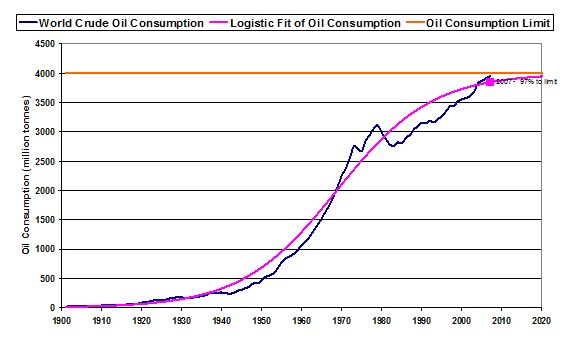
Figure 9: Oil Consumption 1900-2000
Sources: Jenkins (1989), BP (2008)
Figure 9 plots world crude oil consumption from 1900 to 2007. The dips in the oil consumption curve reflect the two oil shocks in the 1970s (1973 and 1979) and the consequences of the Gulf War in 1991. And there will no doubt be another dip due to the economic crisis of 2008-09.
A logistic curve is fitted to the oil consumption line, which assumes a peak annual consumption of 4 Gigatonnes of oil (Gto). Based on this assumed peak of 4 Gto per year, the world has reached 97% of that level in the year 2007. There is vociferous debate as to whether oil consumption will continue to grow, allowing the ceiling to move upward. This model assumes we are near at or near a peak of oil consumption. Alternative future scenarios will be examined in a following section.
Assuming a similar logistic curve could represent Oil Population as depicted in Figure 8, then Oil Population has reached 97% of its hypothetical ceiling, and that ceiling would then be about 2.7 billion people.
Natural Gas Population and the Twenty-first Century
Although the history of natural gas consumption is short and trends are very recent, based on the above figures Natural Gas Population may raise the population ceiling by another billion people or so (Figure 10). This increase is much smaller than the increase due either to coal or oil.
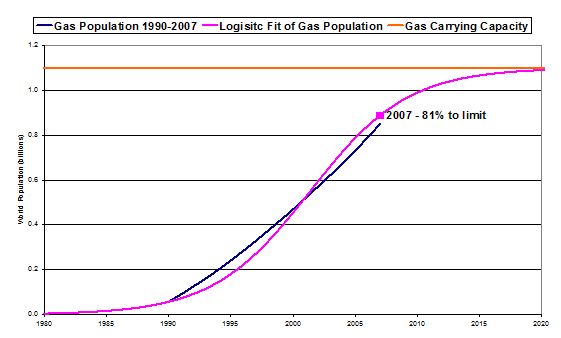
Figure 10: Natural Gas Population –1990-2007
Natural gas is predominantly a rich country fuel. Only 3% of China’s energy consumption is supplied by natural gas and only 9% in India (BP 2008:41). It may be that gas has less impact then oil as oil already enabled most of the improvements in mortality. Also, oil has until now been a much better transportation fuel. It may also be that as the quality of energy sources becomes ever higher, the downward effects on fertility rates become more significant than the downward effects on mortality rates.

Figure 11: World Natural Gas Consumption 1900-2007
Sources: BP (2008)
Again a logistic curve is fitted to the natural gas consumption line (Figure 11), which assumes a peak annual consumption of 3.2 Gigatonnes of oil equivalent (Gtoe). Based on this assumed peak consumption, the world has reached 80% of that level in the year 2007.
Assuming a similar logistic curve could represent Natural Gas Population as depicted in Figure 10, then Natural Gas Population has reached 80% of its ceiling, and that ceiling would then be about 1.1 billion people.
The Sum-Of-Energies Population Model
This is a sum-of-energies Component view of the world’s population:
Biomass Population – Slow Growth – open frontiers – lower quality energy – developing country fuel – low contribution to world’s population
Coal Population– Fast Logistic Growth – forming frontiers – medium quality energy – developing country fuel – high contribution to world’s population
Oil Population – Logistic Growth (so far) – fixed frontiers – high quality energy – global fuel – high contribution to world’s population
Natural Gas Population– Logistic Growth (so far) – fixed frontiers – high quality energy – rich country fuel – low contribution to world’s population
Figure 12 shows the sum-of-energies model of population growth versus actual population growth, projected to 2050.

Figure 12: World Population vs. Sum-of-Energies Population 800-2050
What Next? – Future Scenarios
There are three general scenarios that the world’s energy future may take. Their effects on population will be radically different. They are:
1. Continued fossil fuel growth
2. Fossil fuel decline and no sufficient substitute
3. Fossil fuel decline and a new source of energy
Scenario 1: Continued Fossil Fuel Consumption Growth
In this scenario, fossil fuel consumption continues to grow at similar rates to the recent past and population grows as projected by the United Nations to 9 billion people by 2050.
Based on the above sum-of-energies model, if Oil Population is close to reaching its peak, a much larger share of the world’s population growth will have to be driven by Coal Population, requiring much higher consumption of coal. Unless carbon sequestration technologies quickly become viable, this will have detrimental effects on climate change.
The increased importance of natural gas in the 21st century may also contribute to population growth, as the introduction of new energy sources has done in the past. But based on current trends natural gas will play a much smaller part than coal.
Or population may already be slowing more quickly than most analysts realise.[14] If so, the world’s population in 2050 may be substantially lower, closer to 7.5 billion people (1 billion for Biomass Population, 2.5 billion for Coal Population, 2.7 for Oil Population and 1.1 for Natural Gas Population equals 7.3 billion).
Scenario 2: Fossil Fuel Decline and no Sufficient Substitute
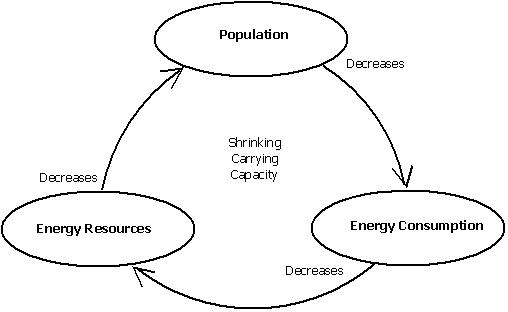
Figure 13 – Population/Energy Dependency – After Peak Energy Production
A decline in oil and gas production would mean a decline in energy inputs into society, a decline in productivity and, hypothetically, a decline in population. If population growth were related to oil production and oil production is beginning to decline, Oil Population will also decline – in other words, its growth curve may change from a slowing logistic curve, to a declining parabolic curve – and therefore a large component of global population will decline more quickly than most people anticipate.
Mortality rates may increase, as a population grown large through dependence on high quality energy sources now must allocate scarcer resources per person. This is evident in agriculture’s dependence on fossil fuel based fertilisers[15]. Without them, agricultural productivity decreases and less people can be fed. Human carrying capacity decreases.
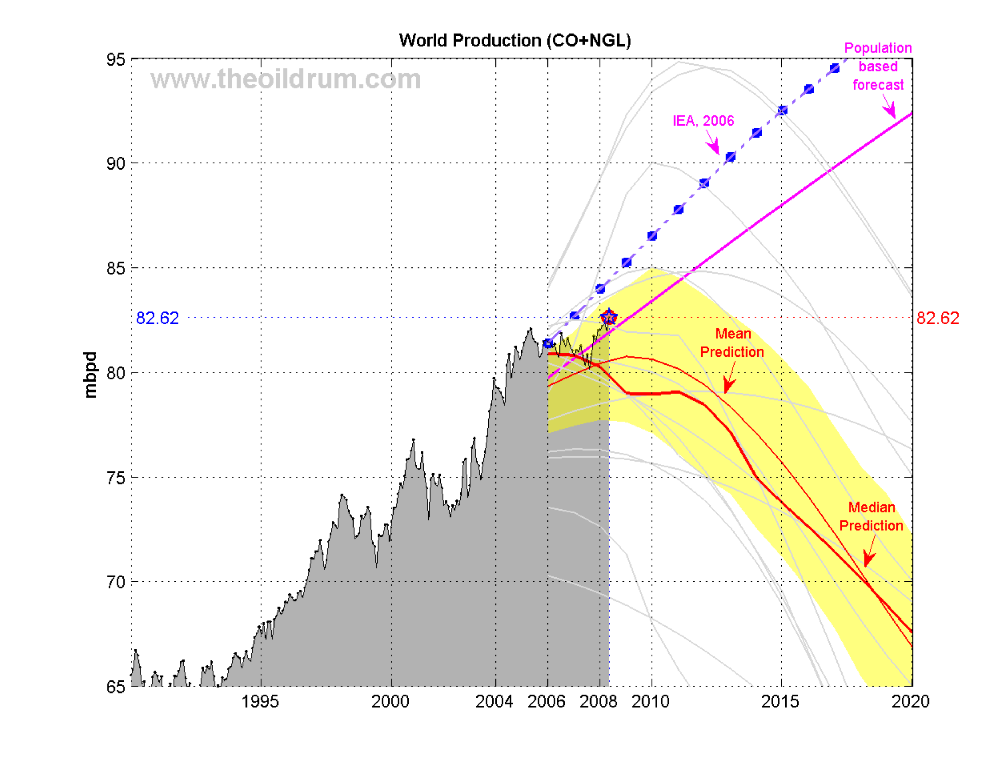
Figure 14 depicts projected world oil production to 2020. These figures are based on conventional crude oil resources and natural gas liquids (CO + NGL). They do not include unconventional oil resources such as shale oil, oil from tar sands, ultra-deep water oil or polar oil. These oil sources are not included because they are much more expensive to extract, in monetary terms but also in energy terms. In other words, a large amount of energy inputs are required to extract energy outputs from say, tar sands in north western Canada. Hence the net energy gain is lower, and these energy sources may not be as important in raising productivity and population ceilings.
Based on these projections, the 3.2 billion people that are dependent on oil in the sum-of-energies population model are in serious jeopardy in the next fifty years as the world’s remaining oil resources are consumed, and world population could suffer a precipitous decline.

Figure 14: Projected World Oil Production
Source: Kebab at http://www.theoildrum.com/files/PU200808_Fig3b_0.png
Scenario 3: Fossil Fuel Decline and a New Energy Source
This scenario follows from Ester Boserup’s observations that many of humankind’s technological innovations have resulted from population pressures, or increased population densities. According to Boserup, demand-induced innovation led to the shift from hunter-gatherer societies to agricultural societies and from the use of wood to coal. One could speculate that a shortage of fossil fuels caused by population pressures would lead to yet more innovation and the discovery of newer and better sources of energy. From our vantage point though, it is not clear what these innovations might be or what new sources of energy would be capable of replacing fossil fuels.
A higher quality energy source, say fission, could lead to further productivity improvements, reducing the pressure on existing resources and further raising the ceiling on population size. But fission still lies closer to the realms of science fiction than science.
A lower quality energy source, like solar or wind power, is less efficient. It has less ability to perform work and to raise productivity. Another problem with low quality energy sources is that their net energy is low – they require a large proportion of energy in, to get some energy out – in contradistinction to oil and gas, which have high net energy values. A switch to a lower quality energy source from fossil fuels will put further pressure on other remaining energy sources, such as wood and coal. This could lead to further pressures on land and other resources and hence lower the population ceiling. Low quality energy resources do not support large populations.
Nuclear power is not the answer. To replace diminishing oil and gas (which currently provides the world with 60% of its energy resources) with nuclear power (which currently provides 5.6%) would not only require vast amounts of capital but would require vast amounts of high quality energy. In a period of declining oil and gas resources, existing energy sources would be getting scarcer.
Perhaps a new high quality source of energy will be found. This would then add a new energy component to population growth. This may lead to a raised population ceiling and an initial burst of population growth as population grows to occupy the space between the previous ceiling and the new ceiling. Then growth may slow again as a new equilibrium is reached.
Summary
The sum-of-energies model of population growth measures a macro phenomenon. The rise and fall of regional and national populations involve many complex issues of which energy resource availability is only one. There is no direct consideration here of mandated population control (China), disease epidemics (AIDS in sub-Saharan Africa), natural disasters such as droughts and floods, war, contraception or lack thereof, either improving (global) or deteriorating (Russia) health care, dramatic declines in birth rates in many parts of the world (Mexico and India) and persistently high rates in other parts (Middle East) – although energy resource availability has an indirect demographic affect on all these phenomena.
The model also represents a macro phenomenon in terms of types of energy resources. Nuclear, hydroelectricity and modern renewables do not figure in this analysis. Their contributions to the global energy mix at present are relatively minor, but they too must contribute somehow to population growth. There is also no mention of energy intensity or energy efficiency.
The model focuses on global effects on human population due to the widespread use of fossil fuels, since the availability of fossil fuel energy resources affects everything we do. It permeates all aspect of our society. If we take a future historical perspective and imagine ourselves looking back at this time from 1000 years hence, our world’s unprecedented population growth (and possible decline) will not be explained by demographic transitions, or industrial revolutions, or health care, or urbanisation, or green revolutions, or contraception, or war, or natural catastrophes. These phenomena will play their part but will be seen as secondary.
In seeking to understand how we balance the needs of an increasing human population against the carrying capacity of our planet, we need to recognise the primary relationship between population growth and energy resources, and that this relationship is both positively and negatively reinforcing.
Bibliography
Anderson, M. (1996). British Population History: From the Black Death to the Present Day. Cambridge University Press.
Boserup, Ester (1981). Population and Technology, Basil Blackwell.
Boserup, Ester (1990). Economic and Demographic Relationships in Development, The John Hopkins University Press.
BP (2008). BP Statistical Review of World Energy, various editions 1979-2008.
Campbell, Colin (1988). The Coming Oil Crisis. Multi-Science Publishing Company.
Coale, Ansley (1974). ‘The History of the Human Population’, Scientific American, September 1974, pp. 41-51.
Cohen, Joel E. (1995). How Many People Can the Earth Support? W. W. Norton and Co.
Cook, Earl (1976). Man, Energy, Society. W. H. Freeman and Co.
Hackett-Fischer, D. (1996). The Great Wave. Oxford University Press.
Hall, Charles A. S., Cutler Cleveland and Robert Kaufman. Energy and Resource Quality: The Ecology of the Economic Process. (1986). John Wiley and Sons.
IEA (International Energy Administration) (1999). World Energy Outlook.
Jenkins, G. (1989). Oil Economists’ Handbook, 5th Edition.
Landes, D. (1998). The Wealth and Poverty of Nations. W. W. Norton and Co.
Livi-Bacci, M. (1997). A Concise History of World Population (Second Edition). Blackwell Publishers.
McEvedy, C. and R. Jones (1978). Atlas of World Population History. Penguin Books.
Nakicenovic, N. 1987. ‘Technological substitution and long waves in the USA in T. Vasko (ed.) The Long Wave Debate pp. 76-104. Springer-Verlag.
Pimentel, D. and M. Pimentel (1979). Food, Energy and Society. Edward Arnold.
Pimentel, D. and C. W. Hall (editors) (1989). Food and Natural Resources. Academic Press.
Schurr, S. H. and B. C. Netschert (1960). Energy in the American Economy 1850-1975. John Hopkins Press.
Smil, Vaclav (1994). Energy in World History. Westview Press.
Tainter, Joseph A. (1988). The Collapse of Complex Societies. Cambridge University Press, Cambridge U.K.
Tranter, N. L. (1996). British Population in the Twentieth Century. MacMillan Press Ltd.
United States Bureau of the Census (1960). Historical Statistics of the United States: Colonial Times to 1957. U.S. Government Printing Office, Washington,D.C.
United States Bureau of the Census. various editions. Statistical Abstract of the United States. U.S. Government Printing Office, Washington, D.C.
WEC (World Energy Council) (1995). Global Energy Perspectives to 2050 and Beyond. WEC, London.
Woods, J. W. (1998). ‘A theory of preindustrial population dynamics: demography, economy, and well-being in Malthusian systems’, Current Anthropology 39:99-133.
Wrigley, E. A. (1990). Continuity, Chance and Change. Cambridge University Press, Cambridge, U.K.
Wrigley, E. A. (1992). ‘The classical economists, the stationary state, and the Industrial Revolution.’ Australian National University, Canberra.
Wrigley, E. A. and R. S. Schofield (1981). The Population History of England 1541-1871. Edward Arnold.
Zabel, Graham (2000a). ‘Population and Energy’. http://dieoff.org/page199.htm.
Zabel, Graham (2000b). ‘U.S. Bureau of the Census population projections: Are they getting any better?’. Unpublished.
Endnotes
[2] http://www.eia.doe.gov/oiaf/ieo/ieorefcase.html, table A14. While the EIA presents several different future scenarios: high economic growth/low economic growth, high price/low price, one invariant is their estimate of future world population: 8.3 billion in 2030 – exactly in line with standard UN estimates. In the IEA’s World Energy Outlook report for 2008, under their World Energy Model assumptions, Population Assumptions (, page 7) they state: “Rates of population growth for each region are based on the most recent projections contained in the United Nations‘ Population Division report”
[3] see Wikipedia’s entry on Population Growth, http://en.wikipedia.org/wiki/Population_growth
or Smil (1994:253), Boserup (1981:125), Cohen (1995:42) or Zabel (2000a:11).
[4] a term borrowed from evolutionary biology, and coined by well-known scientist Steven Jay Gould who argues that evolution proceeds dramatically in short bursts of geological time rather than at a constant rate.
[5] U.S. Bureau of the Census International Data Base, http://www.census.gov/ipc/www/idb/worldgrgraph.html
[6] The concept of energy eras, or energy long cycles (of approximately 50 years and sometimes related to Kondratieff cycles) has been noted by several observers. Nakicenovic (1987) lists the “age of canals” (1773-1840), the “age of railroads” (1840-1895), the “age of electricity” (1895-1945), the “age of oil” (1945-1995) and predicts a new energy era starting in the 1990s and suggests that natural gas will be the best candidate. In this case the first three “ages” are all based on the consumption of coal. See also Smil, Energy in World History, p. 240-241.
[9] According to extensive research carried out by the Cambridge Historical Demography group. See Wrigley and Schofield (1981).
[11] Calculated from population figures in U.S. Bureau of the Census’ Historical Statistics of the United States: Colonial Times to 1957 and subsequently for the U.S. Bureau of the Census’ on-line International Database.
[12] Energy Information Administration, http://www.eia.doe.gov/cneaf/electricity/epm/table1_1.html.
[14] Zabel, “U.S. Bureau of the Census Population Projections: Are they getting any better?”. Figures 1 and 2 on page 3 show that since 1975, future world population projections have been consistently too high and over time they show a marked downward trend. “It appears that the magnitude of the slowing of the world’s population growth rate has taken forecasters by surprise and continues to do so.” (p. 3).


