
This peak oil overview is written in the format of a presentation with comments. This overview is also available as a Powerpoint presentation and as a Handout PDF at TheOilDrum.com
Outline
• The US oil story
• The world oil story
• Five myths2
The US Oil Story 3
The US Oil Story
4
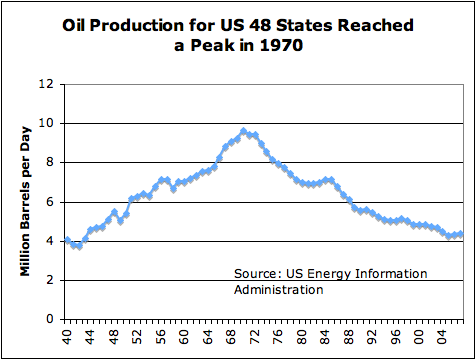
Comments: US oil production has been declining since 1970, in spite of technology advances and new drilling in the Gulf of Mexico. The recent dip and uptick reflects lower production in 2005 due to hurricane damage, followed by a bounce back in 2006 and 2007, as the damage was repaired.
US Peak in 1970 • US had been world’s largest producer
• Peak came as a surprise to most
—Had been predicted by Hubbert in 1956• Precipitated a rush to find oil elsewhere
—Ramp up Saudi and Mexico production
—New production in Alaska and North Sea5
Comments: We were fortunate in 1970 to find other places in the world where oil was available, but had not yet been developed. There are still a few such sites available (for example, some US sites that have been placed off-limits for development), but they are much smaller in relationship to what was available in 1970.
M. King Hubbert had predicted in 1956 that the US production of oil would peak in 1970, but few believed him.
On page 22 of the same report, he predicts that world oil production will peak “about 2000”. His prediction was made in 1956. As such, it did not reflect significant changes in the 1970s, including the significant recession of the 1973-1975 period, the switch to nuclear and natural gas instead of petroleum for electricity generation, and mileage improvements for cars. If these had been reflected, the predicted peak would have been several years later.
Saudi increases were quickest • Saudi oil company was run by Americans
—Able to ramp up quickly• OPEC embargo in 1973, however
—Oil shortages
—Huge oil price run-ups
—Lead to major recession 1973 – 756
Comments: According to Wikipedia, Arabian American Oil Company (Aramco) was jointly owned by four US oil companies in 1970. In 1973, the Saudi Arabian government acquired 25% of the company. The percentage ownership was increased to 60% in 1974, and 100% in 1980.
OPEC began operation in 1965, but did not have pricing leverage until the United States could no longer produce the vast majority of its own oil, because of its decline in production. In October 1973, OPEC initiated an oil embargo against countries that supported Israel in the Yom Kippur War, particularly targeting the United States and Netherlands. The embargo lasted only a few months, until March 1974.
During this time, there was a sharp rise in oil prices, and a sharp drop in the stock market. In the United States, gasoline was rationed with people able to buy on odd or even days, depending on the last digit in their license plate number. According to Wikipedia, oil consumption in the United States dropped by 6.1% during this period.
The 1973-75 recession was the most severe recession since World War II. Merrill Lynch says it believes the current recession will be similar to that recession.
Other oil online by late 1970s
7
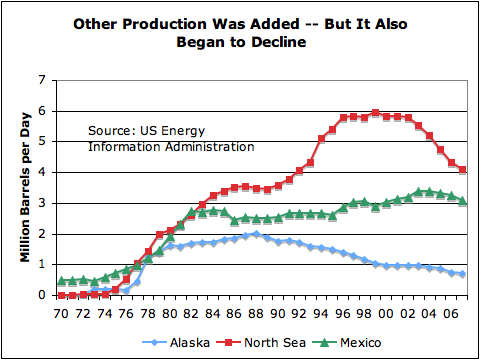
Comments: Even when an oil company wants to start new production quickly, it is difficult to do so. The ramp up in Alaska oil production had to wait until the Trans-Alaskan Pipeline System was completed in 1977.
It was known that oil was available in the North Sea prior to the oil embargo. It was not until the price run-up related to the embargo that it was economically feasible to drill there, however.
Production in all three of the areas shown is now declining. Alaskan production reached its peak in 1988; the North Sea peaked in 1999; and Mexico peaked in 2004. The shapes of the production curves vary for the different locations, depending on where the oil was located, and how it was produced.
Now the US is a major importer of oil
and a tiny user of newer renewables
8
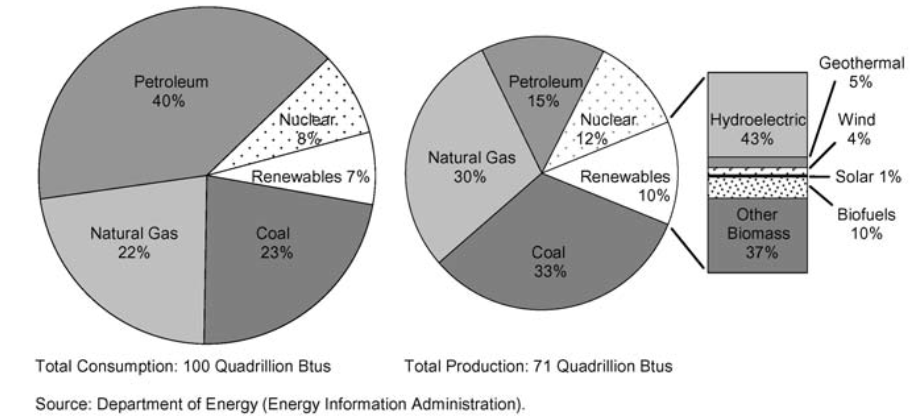
Comments: This figure is from Page 166 of the 2008 Economic Report of the President. The data shown are 2006 figures. Percentages for the newer renewables would be slightly higher for 2007.
The larger circle on the left represents consumption. It totals 100 quadrillion Btus. The smaller circle represents production. It totals 71 quadrillion Btus. Renewables are in the section pulled out. In total, renewables amount to 10% of production or 7% of consumption. The vast majority of renewables are hydroelectric and “other biomass” (wood used to heat homes and fuel some electric generating plants).
Reading Slide 8 • About two thirds of oil is imported
• Biofuels make up about 1.0% of energy production – a little less of use
• Wind comprises 0.4% of energy production
• Solar comprises 0.1% of energy production
9
Comments: We use a huge amount of oil and other fossil fuels. Even with big ramp up in alternatives, they are still tiny. If a cutback is made in fossil fuels, either because of shortages or because of a desire to reduce carbon dioxide, it seems clear that at least part of the response will have to be reduce total energy usage.
The World Oil Story 10
World Oil: Discoveries follow same pattern as US production
11
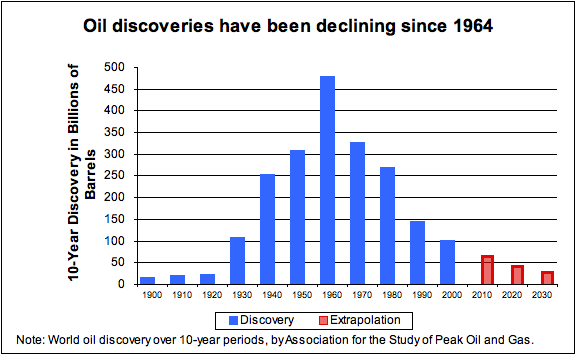
Comments: The discovery information is based on backdated information – what we now think old discoveries were worth. Some of the big oil fields in the Middle East were discovered about 1960. We are still discovering new fields, but they tend to be smaller and more difficult to extract. The discovery information includes only liquid oil, not oil in the form of tar or other solids.
The combination of discoveries which peaked many years ago, and oil extraction which tends to peak in individual areas, leads one to believe the eventually world oil production will peak. There will still be oil in the ground, but it will be difficult to extract. Eventually, we simply won’t be able to keep extracting as much as we would like:
• As oil fields get older, the percentage of water extracted with the oil tends to increase. In some cases the water percentage exceeds 99%. Once an oil field’s water production exceeds the installed water handling capability, production will need to be reduced. When the cost of additional water handling capability exceeds the cost of oil extracted, it stops making economic sense to extract the oil.
• Some of the oil will be mixed with toxic chemicals like poisonous hydrogen sulfide gas. Special techniques will be required to safely extract this oil. This process will be expensive and time consuming. A giant oil field discovered in Kazakhstan in 2000 has this problem and isn’t expected to come on line until at least 2011.
• Some of the oil is found extremely deep beneath the sea. Special techniques need to be developed to deal with the high pressures and the temperature differentials encountered when drilling in these locations. Developing these new techniques takes time and is expensive. At some point, we will reach our limit on deep sea drilling.
• Some of the oil is very viscous, akin to tar. It can only be extracted by digging. Production requires inputs of fresh water and natural gas. Once limits on either of these are reached, production must stop. In some cases nuclear may be substituted for the natural gas, but this takes time, money, and agreement of the local population.
World oil production has stalled
12

Comments: Oil production on an “all liquids” basis was flat for the years 2005, 2006, and 2007. On an energy available basis, production actually declined. There are several reasons for this:
• The “All Liquids” summary includes lower energy products like ethanol and natural gas liquids. These have been growing, while crude oil production has tended to slightly decline since 2005.
• The oil produced requires more and more energy in extraction, because it is mixed with more and more water, and is found in deeper and deeper locations. More energy is required for extraction, leaving less for end users.
• If we look at oil available for imports, this has been declining since 2005. Part of the reason is the greater amount of oil used in extraction; part of the reason is that the standard of living in oil exporting nations is rising, so these nations are using more of the oil themselves, leaving less to export.
And prices are spiking
13
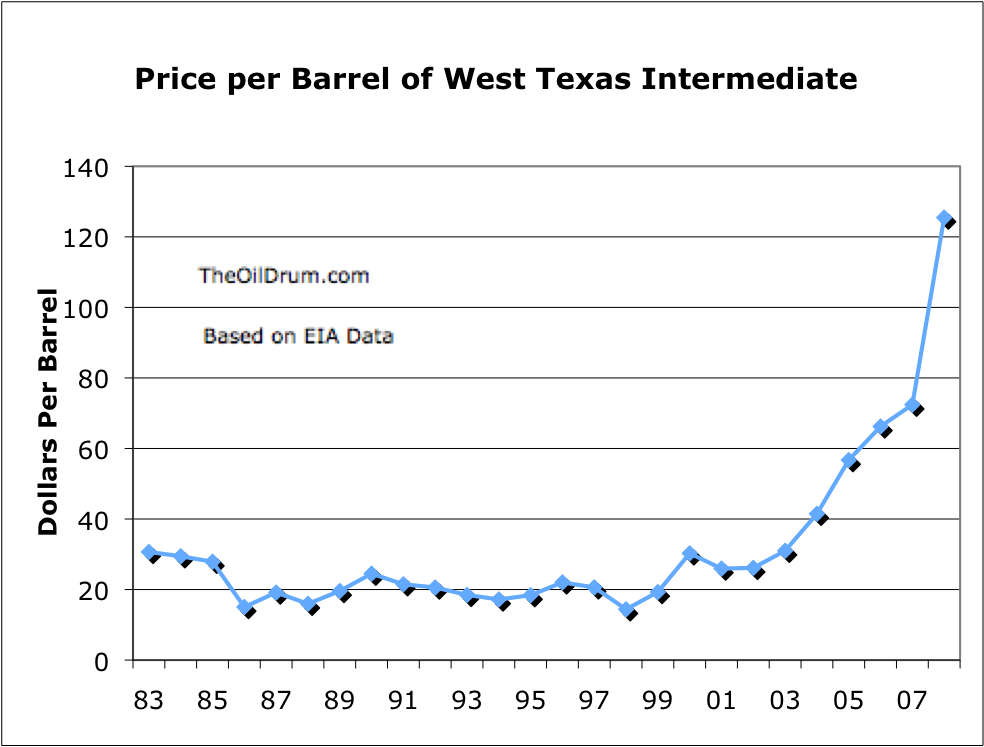
Comment: The fact that oil prices have been spiking since 2005 should come as no surprise. I show an estimated 2008 price on this graph, based on May 2008 prices, since we know the price spike has continued into 2008.
Given the shrinking supply and rising demand, the rise in prices was close to inevitable. Some of the poorer countries are being priced out of the market, and the use of coal is rising, particularly in China.
The higher prices have stimulated work on fields that were known, but not fully developed. Recent data compiled on oil megaprojects indicates that oil companies are now making a concerted effort to develop sites that may be available but have not yet been developed. Many of these projects are expected to begin production in 2008 and 2009, but delays are common because of shortages of manpower and drilling rigs, and because of cost over-runs.
It might be noted that in the 2000 to 2002 period, production stalled and even dropped a bit. Prices did not rise during this time period. They actually fell a bit. The reason for the decline during this period was lack of demand, due to recession. Now, many potential buyers are asking for more, but production does not seem to rise accordingly.
World has little spare oil production capacity
Saudi claims spare capacity, but current discussions relate to only
0.2 million BPD – would leave production below 1980-81 levels.
14
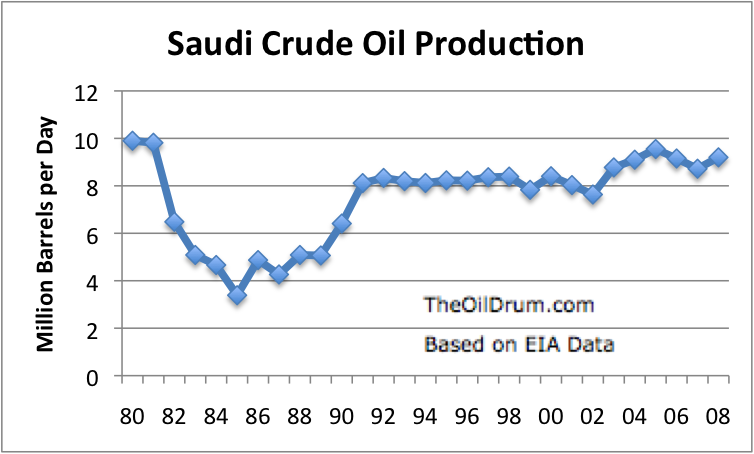
Comment: Saudi Arabia claims between 1.5 million and 2.0 million barrels per day of spare oil production capacity. There has been no outside agency auditing its statements for accuracy, so we do not know if its spare production estimate is accurate. Also, we don’t know what type of oil is represented by this spare capacity. If the only crude available is very heavy, sour crude for which there is little refining capacity, the extra capacity may not be very helpful.
Saudi Arabia called a producer-consumer summit meeting on Sunday, June 22 to discuss how to stabilize prices. Saudi Arabia announced at that meeting that it will raise production by 200,000 barrels a day, apparently to 9.7 million barrels a day. At this level, crude oil production will be slightly over 2005 production of 9.55 barrels a day, but still below its 1980-81 level of production.
An increase of 200,000 barrels a day is quite small–about 0.2% of world production, so it is not clear it will make much of a difference. If the oil is very difficult to refine, this could limit the benefit further.
OPEC’s true reserves are unknown • Published reserves are unaudited
• Last Saudi reserve while US involved was 110 Gb in 1979 (perhaps 168 at “expected”)
—Production to date 81 Gb, implying 29 to 87 Gb remaining; Saudi claims 264 Gb remaining• Kuwait published 96.5 Gb – Audit 24Gb
• GW Bush says regarding asking Saudi Arabia for more oil
—“It is hard to ask them to do something they may not be able to do.”15
Comment: If one analyzes the reserves for OPEC countries, one very quickly comes to the conclusion that the published numbers are unreasonably high.
This is the story: In the early 1980s, OPEC oil countries were all vying for high quotas. To get those high quotas, they believed that publishing high reserves would be helpful. One by one, OPEC oil countries raised their reserve estimates, in an attempt to make it look like they had more oil, so deserved higher quotas. To further this illusion, they kept the reserve numbers at the new high level, even when oil had been pumped out, and no new oil had been found.
The practice has continued for years. OPEC leaders found that by overstating their reserves, they gained new respect, both within their own countries and abroad. They also found that the practice was very easy to do, since no one is auditing the reserve numbers they provide.
A graph of OPEC oil reserves over time is as follows:
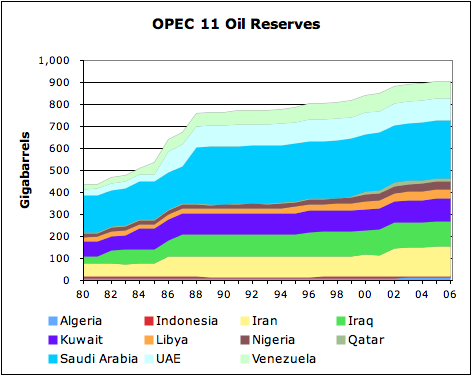
There are many other ways this problem can be seen. For example, OPEC’s oil production is unreasonably low in relationship to its reserves, unless the countries are inept at production or are misstating their reserve amounts. (See The Disconnect Between Oil Reserves and Production.)
Another insight can be gained by looking at Saudi oil reserves, when Americans were involved in setting reserves. According to Matt Simmons’ “Twilight in the Desert”, Saudi oil reserves were 110 Gigabarrels (Gb or billion barrels in US terminology) in 1979, back when Americans were still partial owners of Aramco. If we subtract the 81 Gb pumped out since then, this suggests remaining reserves of 29 Gb.
If is likely that the 1979 American estimate was low. If, instead, we use the Saudi published estimate of 168 Gb in 1980, and subtract from it production of 81 Gb to date, we get an estimate of 87 Gb. This is less than a third of the 264.3 Gb that Saudi Arabia is currently reporting as reserves!
Kuwait is another country where we have an alternate estimate of the proven reserves available. An analysis by the Kuwait Oil Company as of December 31, 2001, showed proven reserves for the country of 24 Gb. Their published reserves were 96.5 as of December 31, 2001, moving up to 101.5 as of December 31, 2006!
President George W. Bush seems to be aware of Saudi Arabia’s production/reserve problems. In an interview on ABC’s Nightline, when asked why he didn’t pressure the king for more oil, George Bush said
If they don’t have a lot of additional oil to put on the market, it is hard to ask somebody to do something they may not be able to do.
US textbooks and newspapers seem to be unaware of the problem with OPEC reserves. They continue to quote huge “proven reserves” for most of the OPEC countries. The word proven adds credibility to the numbers, suggesting that somehow, the reserves have been proven to some authority, when nothing could be further from the truth.
The United States Geological Service (USGS) has added further to the confusion. It has taken the absurd reserves published by OPEC and made calculations based on US development patterns suggesting that OPEC reserves may, in fact, be low. USGS publishes its even higher estimates, confusing the situation further.
FSU production has increased recently (but may decline in ‘08)
16
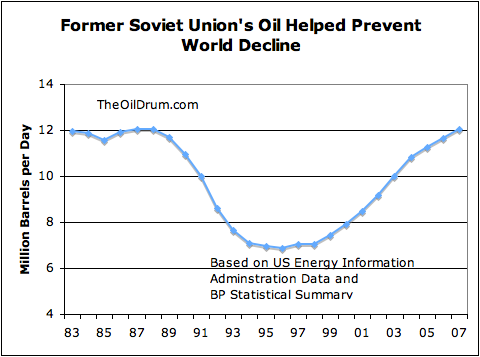
Comment: The Former Soviet Union (FSU) saw a sharp decline in oil production in the late 1980s and early 1990s. With the adoption of modern extraction methods, they have been able to increase production again. There have also been some recent discoveries brought on line.
Russia represents over three quarters of FSU oil production. Toward the end of 2007, Russia’s oil production began to decline. This decline has extended into the early months of 2008. Russia is now approximately tied with Saudi Arabia as the largest producer of crude oil in the world, so the possibility that Russian production may continue to decline is a serious concern.
Production going forward is uncertain • OPEC refuses to increase quotas
—Possible small increase by Saudi Arabia• Russian production has begun decreasing
• Little hope for US, North Sea, Mexico
• Canadian oil sands contribution is very small
• Recent discoveries have been small, relative to what is needed
• New production techniques can lead to sudden drop-offs
—Followed by small dribble for years from EOR17
Comments: Production going forward is uncertain. OPEC doesn’t seem to willing/able to increase production by more than a token amount; Russia, which is the biggest part of the Former Soviet Union, seems to have begun to decline; and there are a huge number of countries already post-peak, like the United States, Mexico, and the countries that make up North Sea production.
Even Canada, apart from the oil sands, is post peak. Canada depends on imports–heavily from Saudi Arabia–for its oil. While Canada has been exporting oil from the oil sands to the US, there are really two issues involved:
(1) The amount of oil from the oil sands is not likely to ramp up quickly.
(2) Canada is likely to need the oil itself, as its other production declines.
There have been many announcements of new discoveries, like Tupi by Brazil, but these tend to be small relative to the world’s needs. They will also take a long time to develop.
As noted on the slide, newer technologies can lead to sudden drop-offs. One reason is that fancier and fancier extraction tools (such as horizontal wells and maximum reservoir contact wells) have been developed. These are able to suck out a greater percentage of the available oil before production suddenly “hits a wall” when the layer of oil has been extracted, and the remaining oil is mixed with a huge amount of water and under little pressure. If this should happen on an enormous field like Ghawar in Saudi Arabia, we could very quickly see production drop by 2 million barrels a day, or more.
In recent years, quite a few “enhanced oil recovery” (EOR) methods have been developed. While these will have some impact, much of the impact of these methods is already reflected in the production data graphed. In some cases, like Mexico, it has permitted production to continue longer before the inevitable drop in oil production came. In others, it helps wells to continue to produce at a very low level after the vast majority of production is completed. The role of EOR seems likely to be one of making the post peak downslope less steep, rather than preventing decline altogether.
Projections of Future Production Vary Widely
18
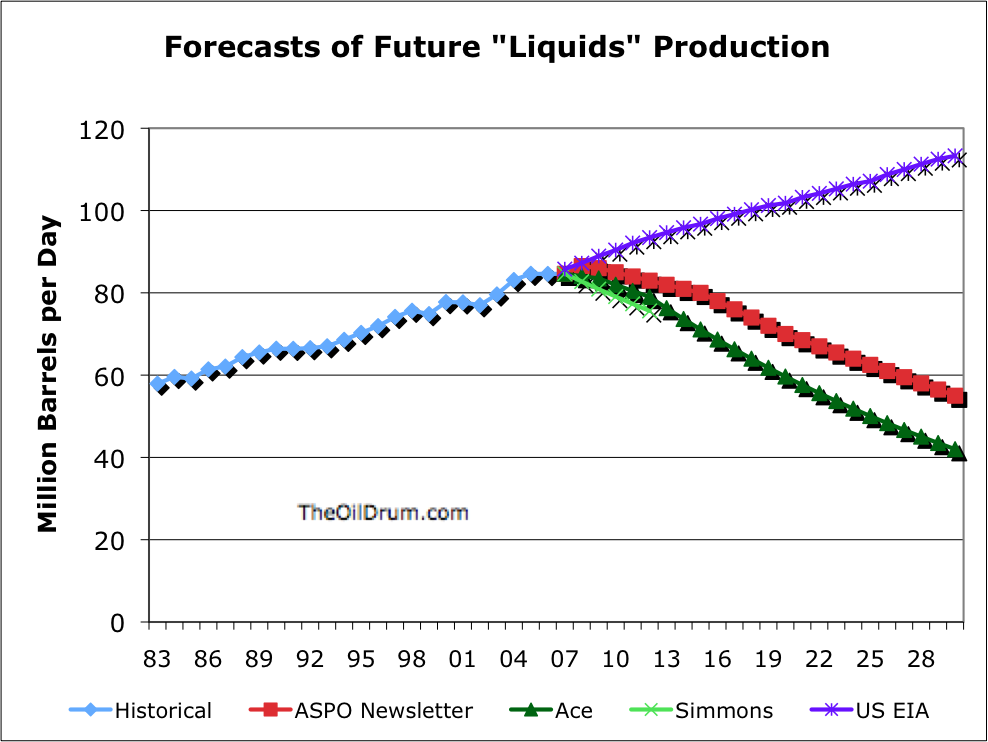
Comment: The highest estimate in slide 18 is from the US Energy Information Administration. It is based primarily on demand, under the assumption that OPEC will always have additional oil available, if needed.
The next highest forecast is from the June 2008 newsletter of the Association for the Study Peak Oil and Gas-Ireland, prepared by Colin Campbell. This is a very well-known forecast. A link to it can be found here. It forecasts a peak in 2008, with a fairly slow decline after 2008.
The next highest forecast is that of Tony Eriksen (“Ace”) of The Oil Drum staff. A link to his forecast can be found here. In this forecast, Ace considers the various Megaprojects, and when they are expected to go on line. He also considers expected decline rates on existing fields. He believes that we are on a plateau now that may last a few years. After that production will decline.
The remaining estimate is by Matt Simmons. In this interview, he mentions that he expects crude oil (not “total liquids”) to drop to 65 million barrels a day by 2013. I have attempted to translate this comment into an equivalent projection, on a total liquids basis. It ends up being just a bit below Ace’s projection.
World “All Liquids” Forecasts • “All Liquids” – Includes biofuels and “coal to liquid” fuels
• US EIA forecast – Based solely on demand
• ASPO Newsletter – Assoc. for the Study of Peak Oil and Gas Ireland, June ’08
• “Ace”- Tony Eriksen, on The Oil Drum
• Simmons – Matt Simmons, recent interview on evworld.com
19
EIA expects biofuels, CTL,
and oil sands to remain small
20
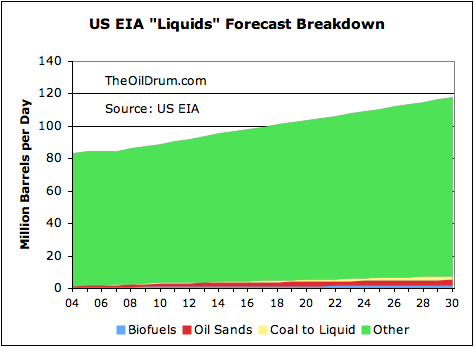
Comment: The US Energy Information Administration’s current projections suggest that it does not expect any of these fuels to grow to be significant between now and 2030.
Five Myths 21
Myth #1: OPEC could produce more if it used current techniques • National oil companies use same service companies US companies do
• Most are using up-to-date techniques
• Expenditures often are high
• Problem is very old fields
• Overstated reserves raise expectations
22
Comment: It is easy to see how this myth might arise, if people believe published reserves.
The International Energy Association (IEA) has indicated that it plans to sharply reduce its world oil supply forecasts, in its next set of forecasts to be published in November 2008.
Myth #2: Drilling in Arctic National Wildlife Refuge will save us 
23
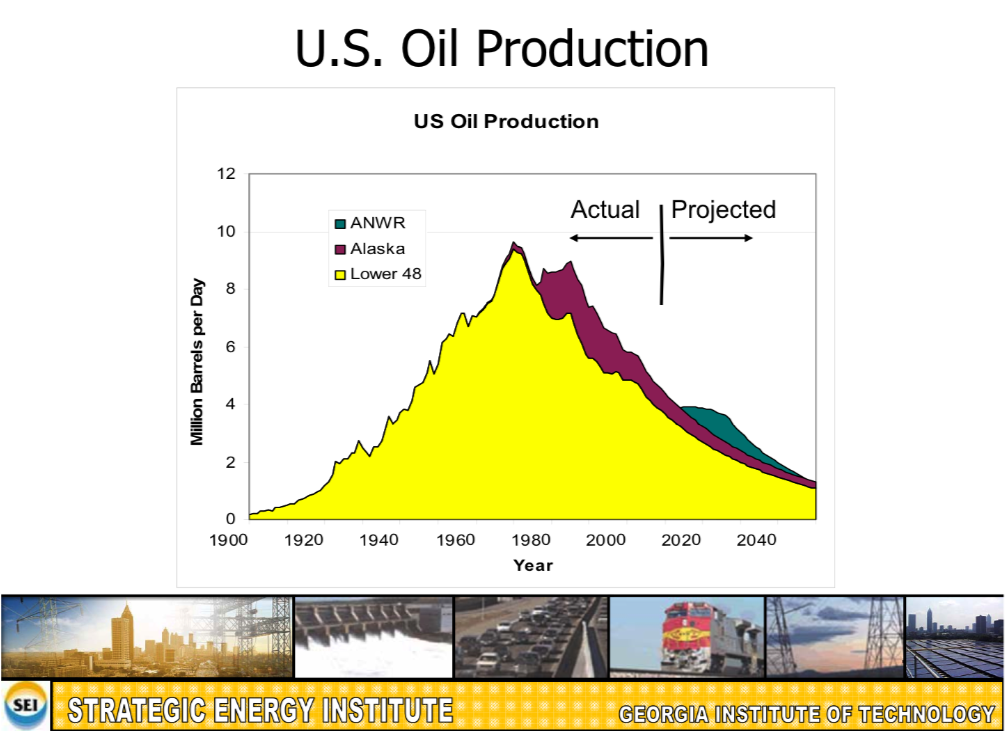
Comment: This slide is from a presentation of Dr. Sam Shelton of Georgia Tech. The oil from ANWR is expected to provide only a small upward “bump” to US production. It is not likely to make a significant difference in world oil supply problem, if/when it actually does come on line, many years from now.
Quite a few of the other much-hyped solutions are expected to provide equivalently little benefit. We will likely need to reduce consumption to better match supply.
Myth #3: A small downturn can easily be made up with energy efficiency • The quickest impacts are financial
—Recession or depression
—Serious recession in 1973 – 75• Use of biofuels raises food prices
—Further increases recession risk• Don’t need peak for recession
—Only need supply/demand shortfall
—Likely what we are experiencing now24
Comment: The connection between oil supply and the economy is not well understood by most. A shortage of oil very quickly leads to an increase in prices and a cutback in the demand for other goods and services. The combination of these events tends to cause a recession. (See The Expected Economic Impact of an Energy Downturn.
Cutting back on usage tends not to be sufficient to prevent the problem, because there are so many other users around the world, including in China and the developing world. They are likely to cause an increasing demand for oil, even if we try to cut back.
Myth #4: Canadian oil sands will save us • Hard to see this with current technology
—Technology known since 1920s
—Production slow and expensive• Natural gas is in limited supply
—Alternatives require more capital• Most optimistic forecasts equal 5% of current world oil by 2030
—Even this exceeds available natural gas25
Comment: There has been commercial development of the Canadian Oil Sands since 1967. Huge amounts have been spent, and there has been great damage to the environment. Even with this, production has remained small–only a little over 1% of world supply. Natural gas limitations suggest that we will never be able to greatly ramp up production. There are also issues with water (pollution, amount required) and carbon dioxide emissions.
It might be noted that a similar argument can be made as to why oil shale will not save us from peak oil. At this point, we don’t even have an economic method of extracting oil shale. From what we know, extraction will require a large amount of water and considerable electricity. Finding adequate water for extraction is likely to be a problem. It is not clear that we will have extra electricity to spare either, for this large a project. Extraction is likely to be slow and expensive, since it will require moving large amounts of dirt around, plus heating and perhaps chilling the dirt. If we are able to extract oil shale, it will likely be in small quantities.
Myth #5: Biofuels will save us • Corn-based ethanol has many problems
—Raises food prices, not scalable, CO2 issues, depletes water supply• Cellulosic ethanol theoretically is better
—Still does not scale to more than 20% of need
—Competes with biomass for electric, home heat• Biofuel from algae might work
—Not perfected yet26
Comment: Every study that has been done recently with respect to corn ethanol seems to produce worse indications. Corn ethanol has virtually no benefits over petroleum. It uses huge amounts of fossil fuels as inputs, so it has most of the drawbacks of fossil fuels. It also has its own drawbacks, including raising prices, damage to the environment, high water usage, and possible CO2 and other global warming gas increases because of land use changes and nitrogen fertilizer use.
At this point, there aren’t good alternatives to gasoline commercially available, however. Since there is great political appeal to growing our own fuel, corn ethanol is supported by most politicians, even if any reasonable analysis would say its benefit is very limited.
Longer term, cellulosic ethanol may be a better solution, but at this time it is not commercially available. Even if we use wood and switchgrass as inputs, cellulosic ethanol will be difficult to scale up to provide more than a small share of the needed fuel.
Biofuel from algae looks to some like it might work. At this point, methods have not yet been perfected.


