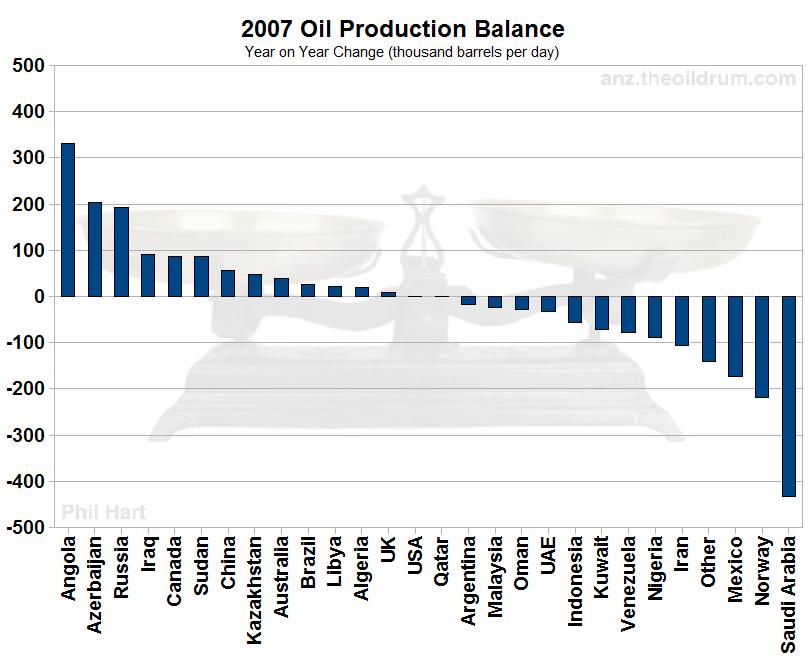
Here then is a chart-fest for all of you, showing the balance between countries who expanded their production compared to the previous year and those whose production declined. It’s pretty self explanatory, but note the difference between the strong growth years around 2004 and the very slight decline experienced in the last two years when the scales have been nearly ‘balanced’.
Click to Enlarge
2007 Net Change: -264kb/d
Charts are based on Energy Information Administration Crude Oil and Condensate data up to and including January 2008. The label “Other” includes Denmark, Ecuador, Columbia, Equatorial Guinea, Gabon, India, Syria, Vietnam, Yemen, Egypt and everything else not individually assessed by the EIA. The 2002-2008 charts have the same total range of 1000kb/d except for 2003 (although 2004 has a different mid-point).
Click to Enlarge
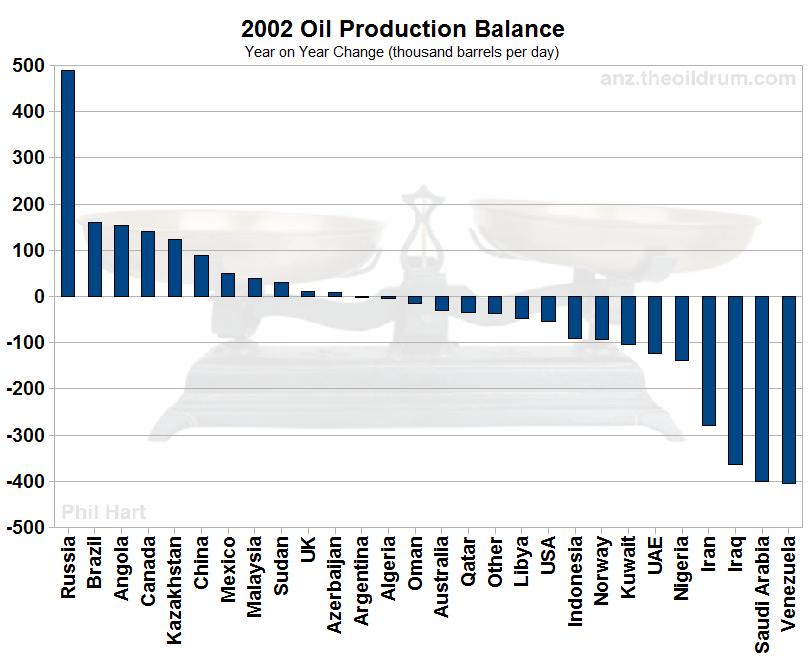
2002 Net Change: -934 kb/d

Click to Enlarge
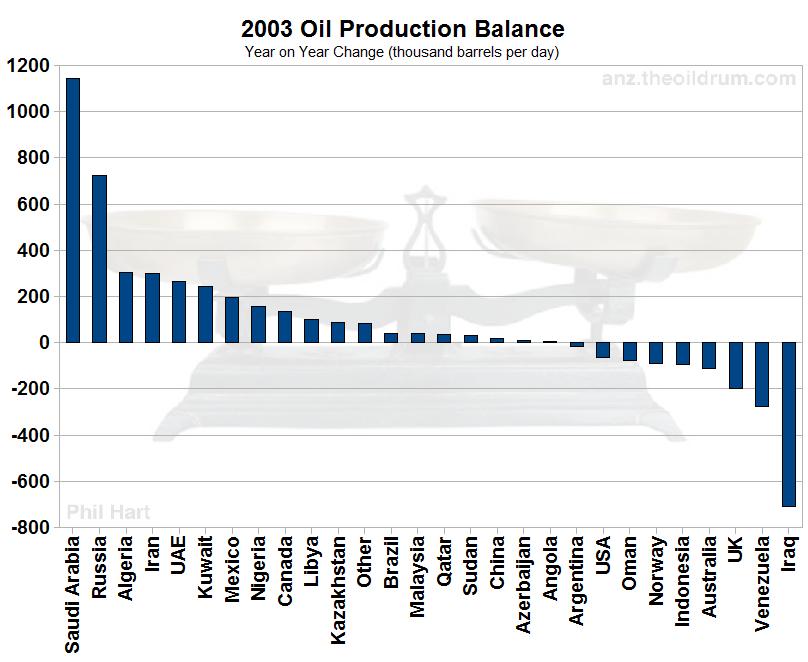
2003 Net Change: +2,279 kb/d
Click to Enlarge
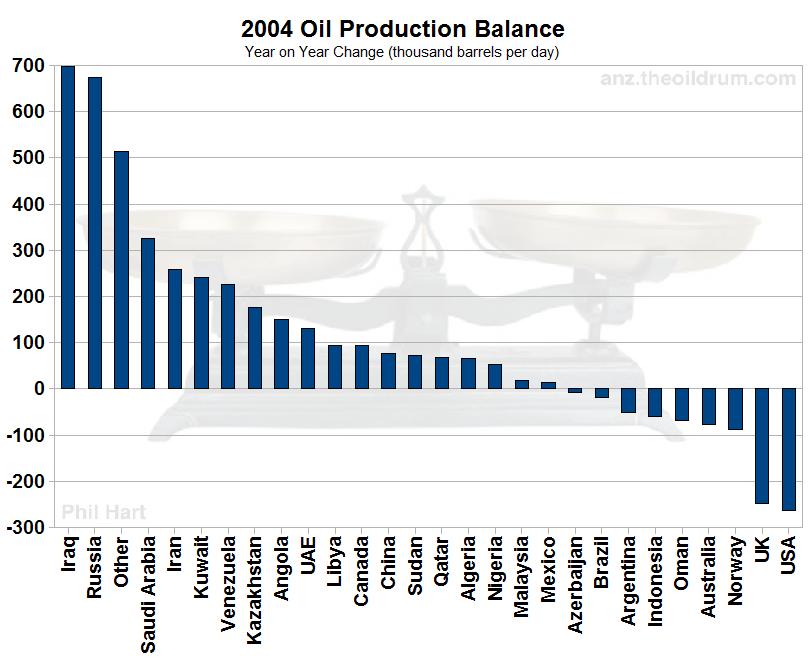
2004 Net Change: +3,065 kb/d
Click to Enlarge
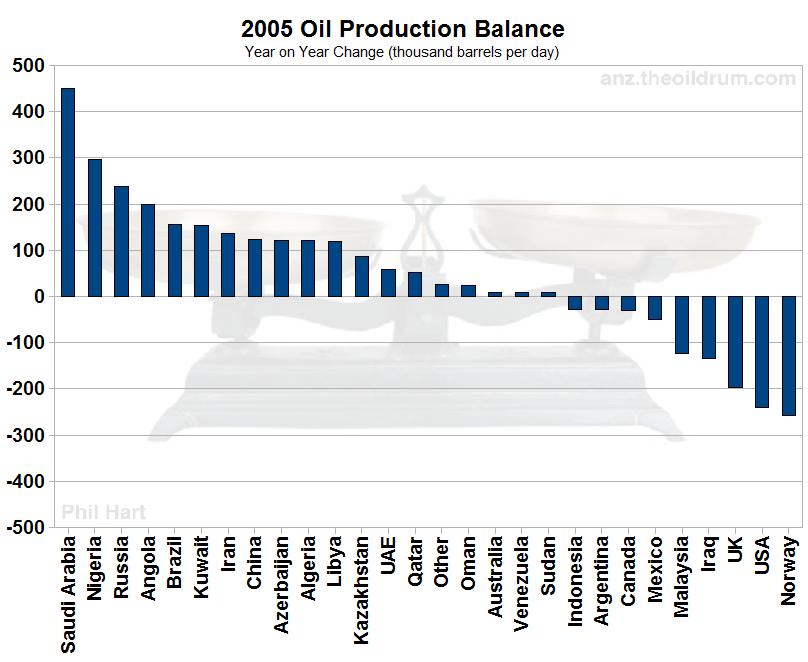
2005 Net Change: 1,294 kb/d
Click to Enlarge
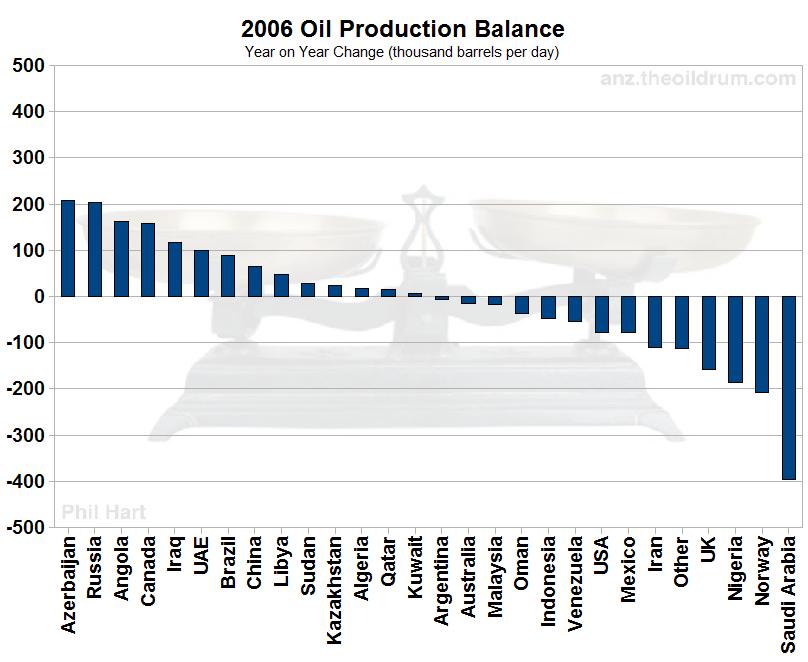
2006 Net Change: -267 kb/d
Click to Enlarge
2007 Net Change: -264 kb/d
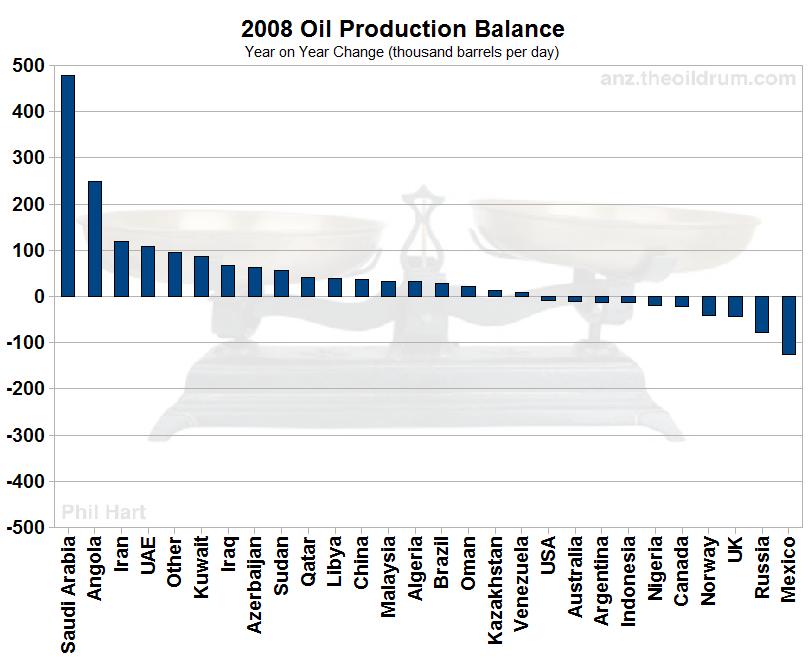
Now, with an enormous caveat that this is based on just one month of data, here is the production balance for the start of 2008 – what a difference compared to last year’s average! Saudi Arabia, which was at the bottom of the class for 2007, has jumped straight to pole position starting 2008 nearly 500kb/d higher than its average for 2007. Meanwhile Russia, a top three performer in 2007, has plummetted to second last although it doesn’t have much company in the ‘declining’ category at this early stage.
Click to Enlarge
2008 Net Change (one month average): +1,192 kb/d
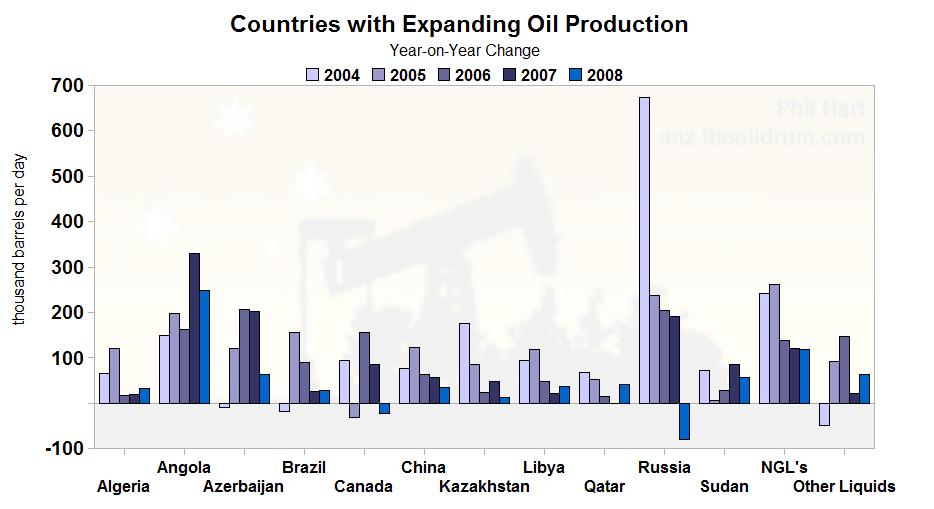
To make sense of this story, we can break these countries into categories. First the category of countries who have shown generally expanding production over the last five years:
Click to Enlarge
Russia has been the star performer in this group but its growth has slowed each year with the trend now taking it to the negative side of the balance sheet. Once we lose Russia from this category, it will be that much harder for expanding countries to outweigh the declining countries. However, Russia has substantial project capacity lined up for 2008/09 so substantial declines may yet be postponed?
Qatar, Libya and Algeria also maintained their positive contributions, as I anticipated in a “Simple Oil Production Estimate for 2007” here at TOD in March last year.
Brazil disappointed in 2007, but we may finally see some of the fruit of their efforts this year so I expect to see it near the top of the table in twelve months time. In return for its incredible (and destructive) toil, Canada continues to eke out small gains. Kazakhstan and especially Azerbaijan continue to build capacity in the Caspian ‘frontier’. NGL’s and to a lesser extent ‘Other Liquids’ are strong contributors to the Total Liquids picture but not of so much interest here.
Despite the individual uncertainties, in aggregate we can be reasonably confident that this group of countries could post a significant gain again in 2008. For the other side of the story, here are the countries which have generally been declining over the last five years:
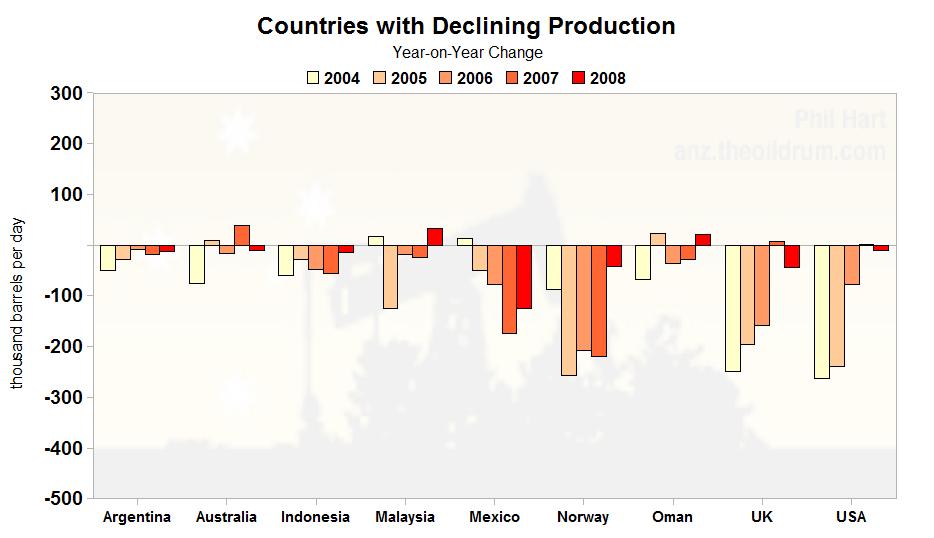
Click to Enlarge
The usual suspects Mexico, Norway and the United Kingdom are here, although the UK managed a tiny gain in 2007. The United States are almost holding their own with recent projects and may do so again in 2008. Australia also has enough new projects to hold steady for awhile. Oman, Indonesia, Malaysia and Argentina are all on a declining trend but not very significant on a global scale.
In total then, this picture of decline is less compelling than I expected. The rest of the story comes from a group of very unpredictable countries:
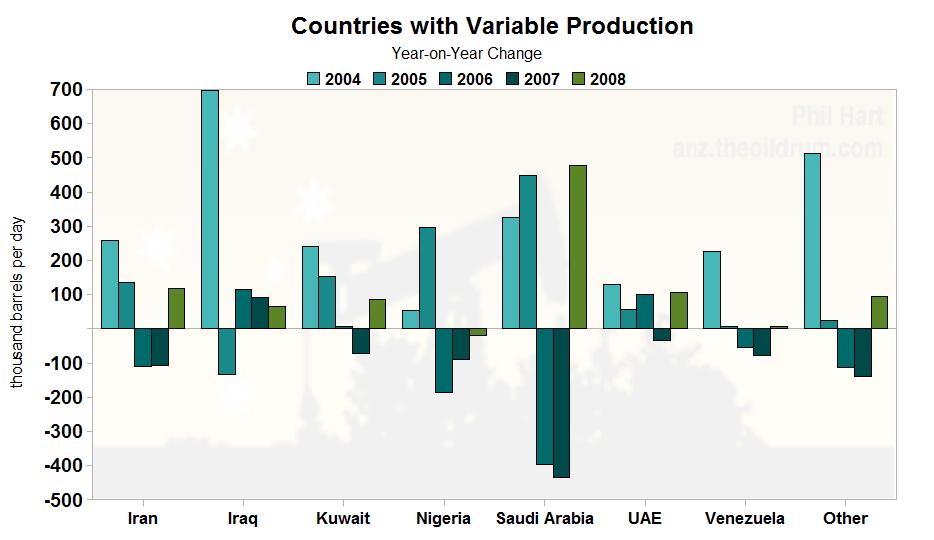
Click to Enlarge
Since 2005, Iraq has been almost the inverse of Nigeria – their respective volatility almost cancelling each other out. The future prospects for these two are as uncertain as ever.
Iran, Kuwait and the United Arab Emirates have a similar pattern of earlier strength followed by declines in 2006-07 with increased production over the last few months. Saudi Arabia is the real wildcard – it alone had the same impact as the previous three combined, but with a similar pattern – ostensibly all in line with their OPEC quotas.
We can then make reasonable predictions for the countries grouped in the expanding and declining categories. The uncertainty ahead remains largely around Saudi Arabia, the combination of Iran, Kuwait, UAE and the impossible to predict Iraq/Nigeria combination.
As a separate mental exercise, we can look at the Megaproject capacity for each country over the same period:

Click to Enlarge
In the chart above for OPEC countries:
- Angola’s production correlates very closely with it’s relentless production expansion over the last five years.
- Iran, Qatar and the UAE may have enough on their books to support their production a little longer.
- The cupboard looks bare for Algeria and Libya this year.
- Saudi Arabia is a wildcard. Khursaniyah due last year should eventually contribute this year. Rumour has it that Khurais will be delayed at least as much, which would not be at all surprising for such a large project in any country.

Click to Enlarge
For the Non-OPEC countries:
- While Brazil showed a solid gain in 2005, its performance in 2007 was poor compared to the massive project capacity. There have been several delays announced so perhaps we will see better things from Brazil this year?
- Russia has massive planned capacity additions for 2008 which may offset its trend into the declining category?
- Canada, Mexico and the U.S. all have big plans for 2008.
- China will not make a significant gain this year – it’s days in the expanding category are also numbered.
Finally, the OPEC vs Non-OPEC production picture tells a thousand words:
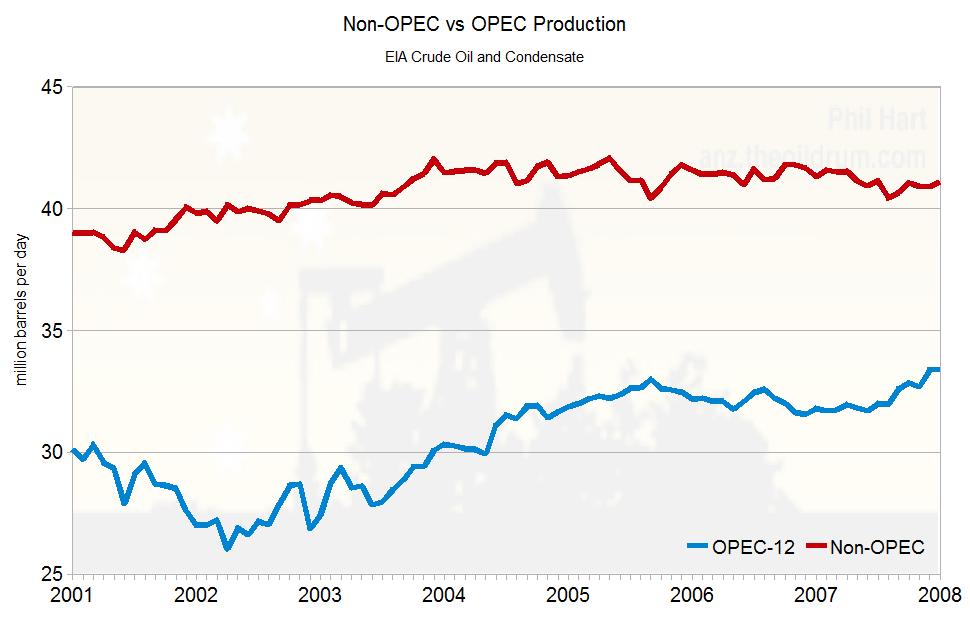
Click to Enlarge
As the energy agencies and other conservative commentators begin to comprehend a peak in Non-OPEC production in the next decade, it increasingly appears to be much closer than that, if not already behind us. Apart from a last megaproject gasp in 2008/09, Russia’s strong growth phase is over. There are now not enough Non-OPEC producers on the positive side of the balance sheet and OPEC’s strategy seems to guarantee that outcome.
If OPEC continues to assimilate countries (like Angola) with expanding production then it is a given that Non-OPEC has passed peak. Yet given the enormous production challenges Iran, Kuwait, United Arab Emirates and Saudi Arabia must be facing, you still have to be impressed that they have managed to increase production over the last few months – these are not incompetent and incapable national oil companies. I believe they had to pull out all the stops and more to achieve this feat, and so they will take any opportunity to relax if demand softens as a U.S. recession unfolds. It will not exactly be voluntarily reducing production, but they will probably call it that.
Given where we are starting 2008 and the Megaprojects due onstream, there is one plausible scenario where production this year exceeds last year’s average. But whether you look at production in Nigeria, Iraq, Iran or Saudi Arabia (or demand in the U.S.) there is plenty of downside potential.
This article is available as a PDF and you can Contact the Author.